Model Performance (TMT)
Who this is for: Talent Management Team managers.
Time: ~8 minutes.
You'll need: the management.tmt.model_performance module. Read
TMT Manager first — the retainer mapping decides whose
queue a model appears in here.
This is where the weekly KPI checklist and platform metrics live — the work that used to sit in Notion. You record each model's week; HRIS does the totals, the rates, the completion percentage, and the report PDF.
Entries are manual, and nothing syncs with Notion
What you type here stays here, and anything left in Notion stays there. Treat HRIS as the source of truth from the week you start using it. Getting the numbers in is what makes the automation around them possible — the report is the first example of that.
This is data entry, not configuration. Unlike Retainer and Affiliate Mapping — which you set once and forget — this is a weekly habit. One row per model per week, filled in as the week closes.
Picking a model
Open Management → TMT → Model Performance. Models are split into two groups:
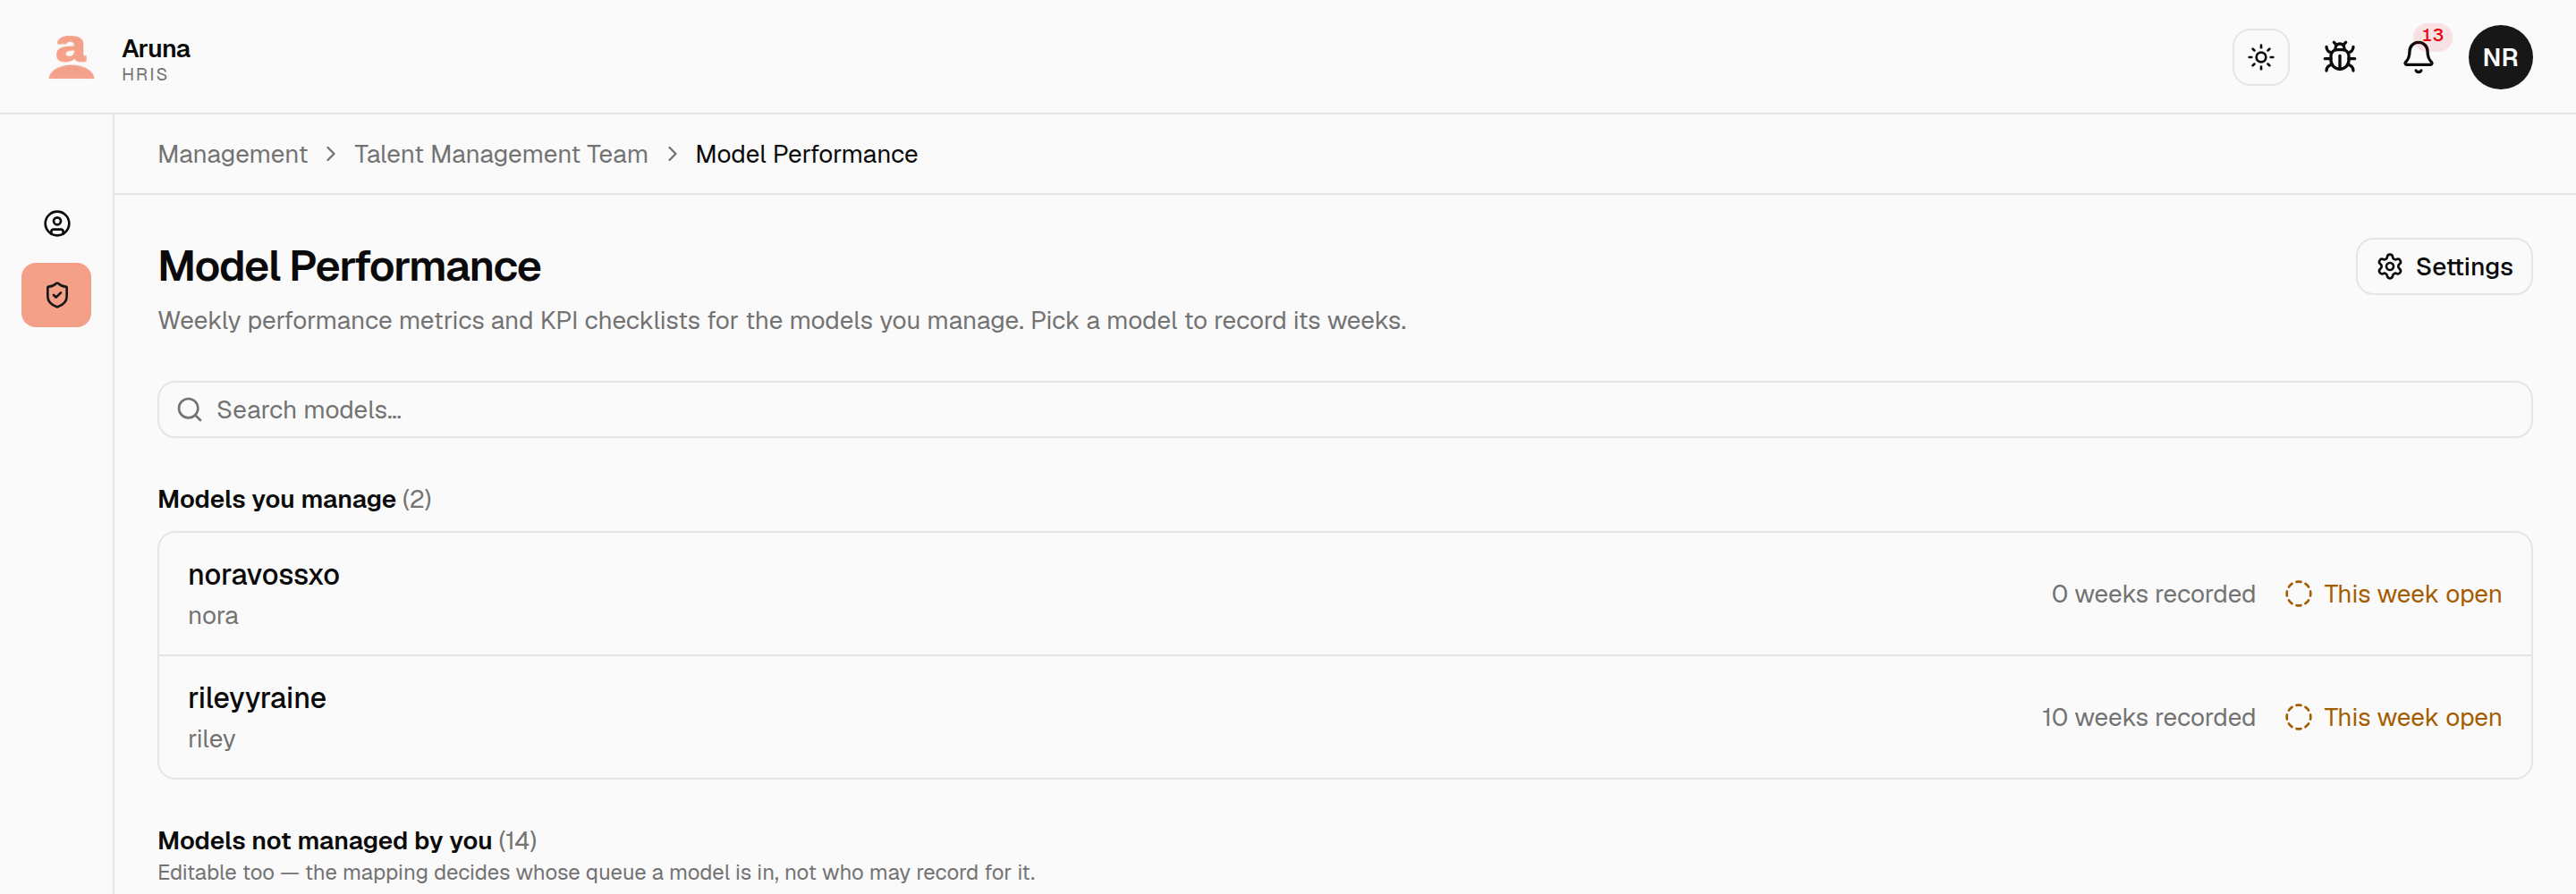
- Models you manage — the models assigned to you in Retainer Mapping. This is your queue.
- Models not managed by you — everyone else's. You can open and edit these too. The mapping decides whose queue a model is in, not who may record for it, so cover is possible when a manager is away.
Each row shows how many weeks are recorded for the year and whether the current week is done or still open — so you can see your outstanding work without opening anything.
The weekly sheet
Open a model. The Weekly sheet tab is the default — it's what you came to do.
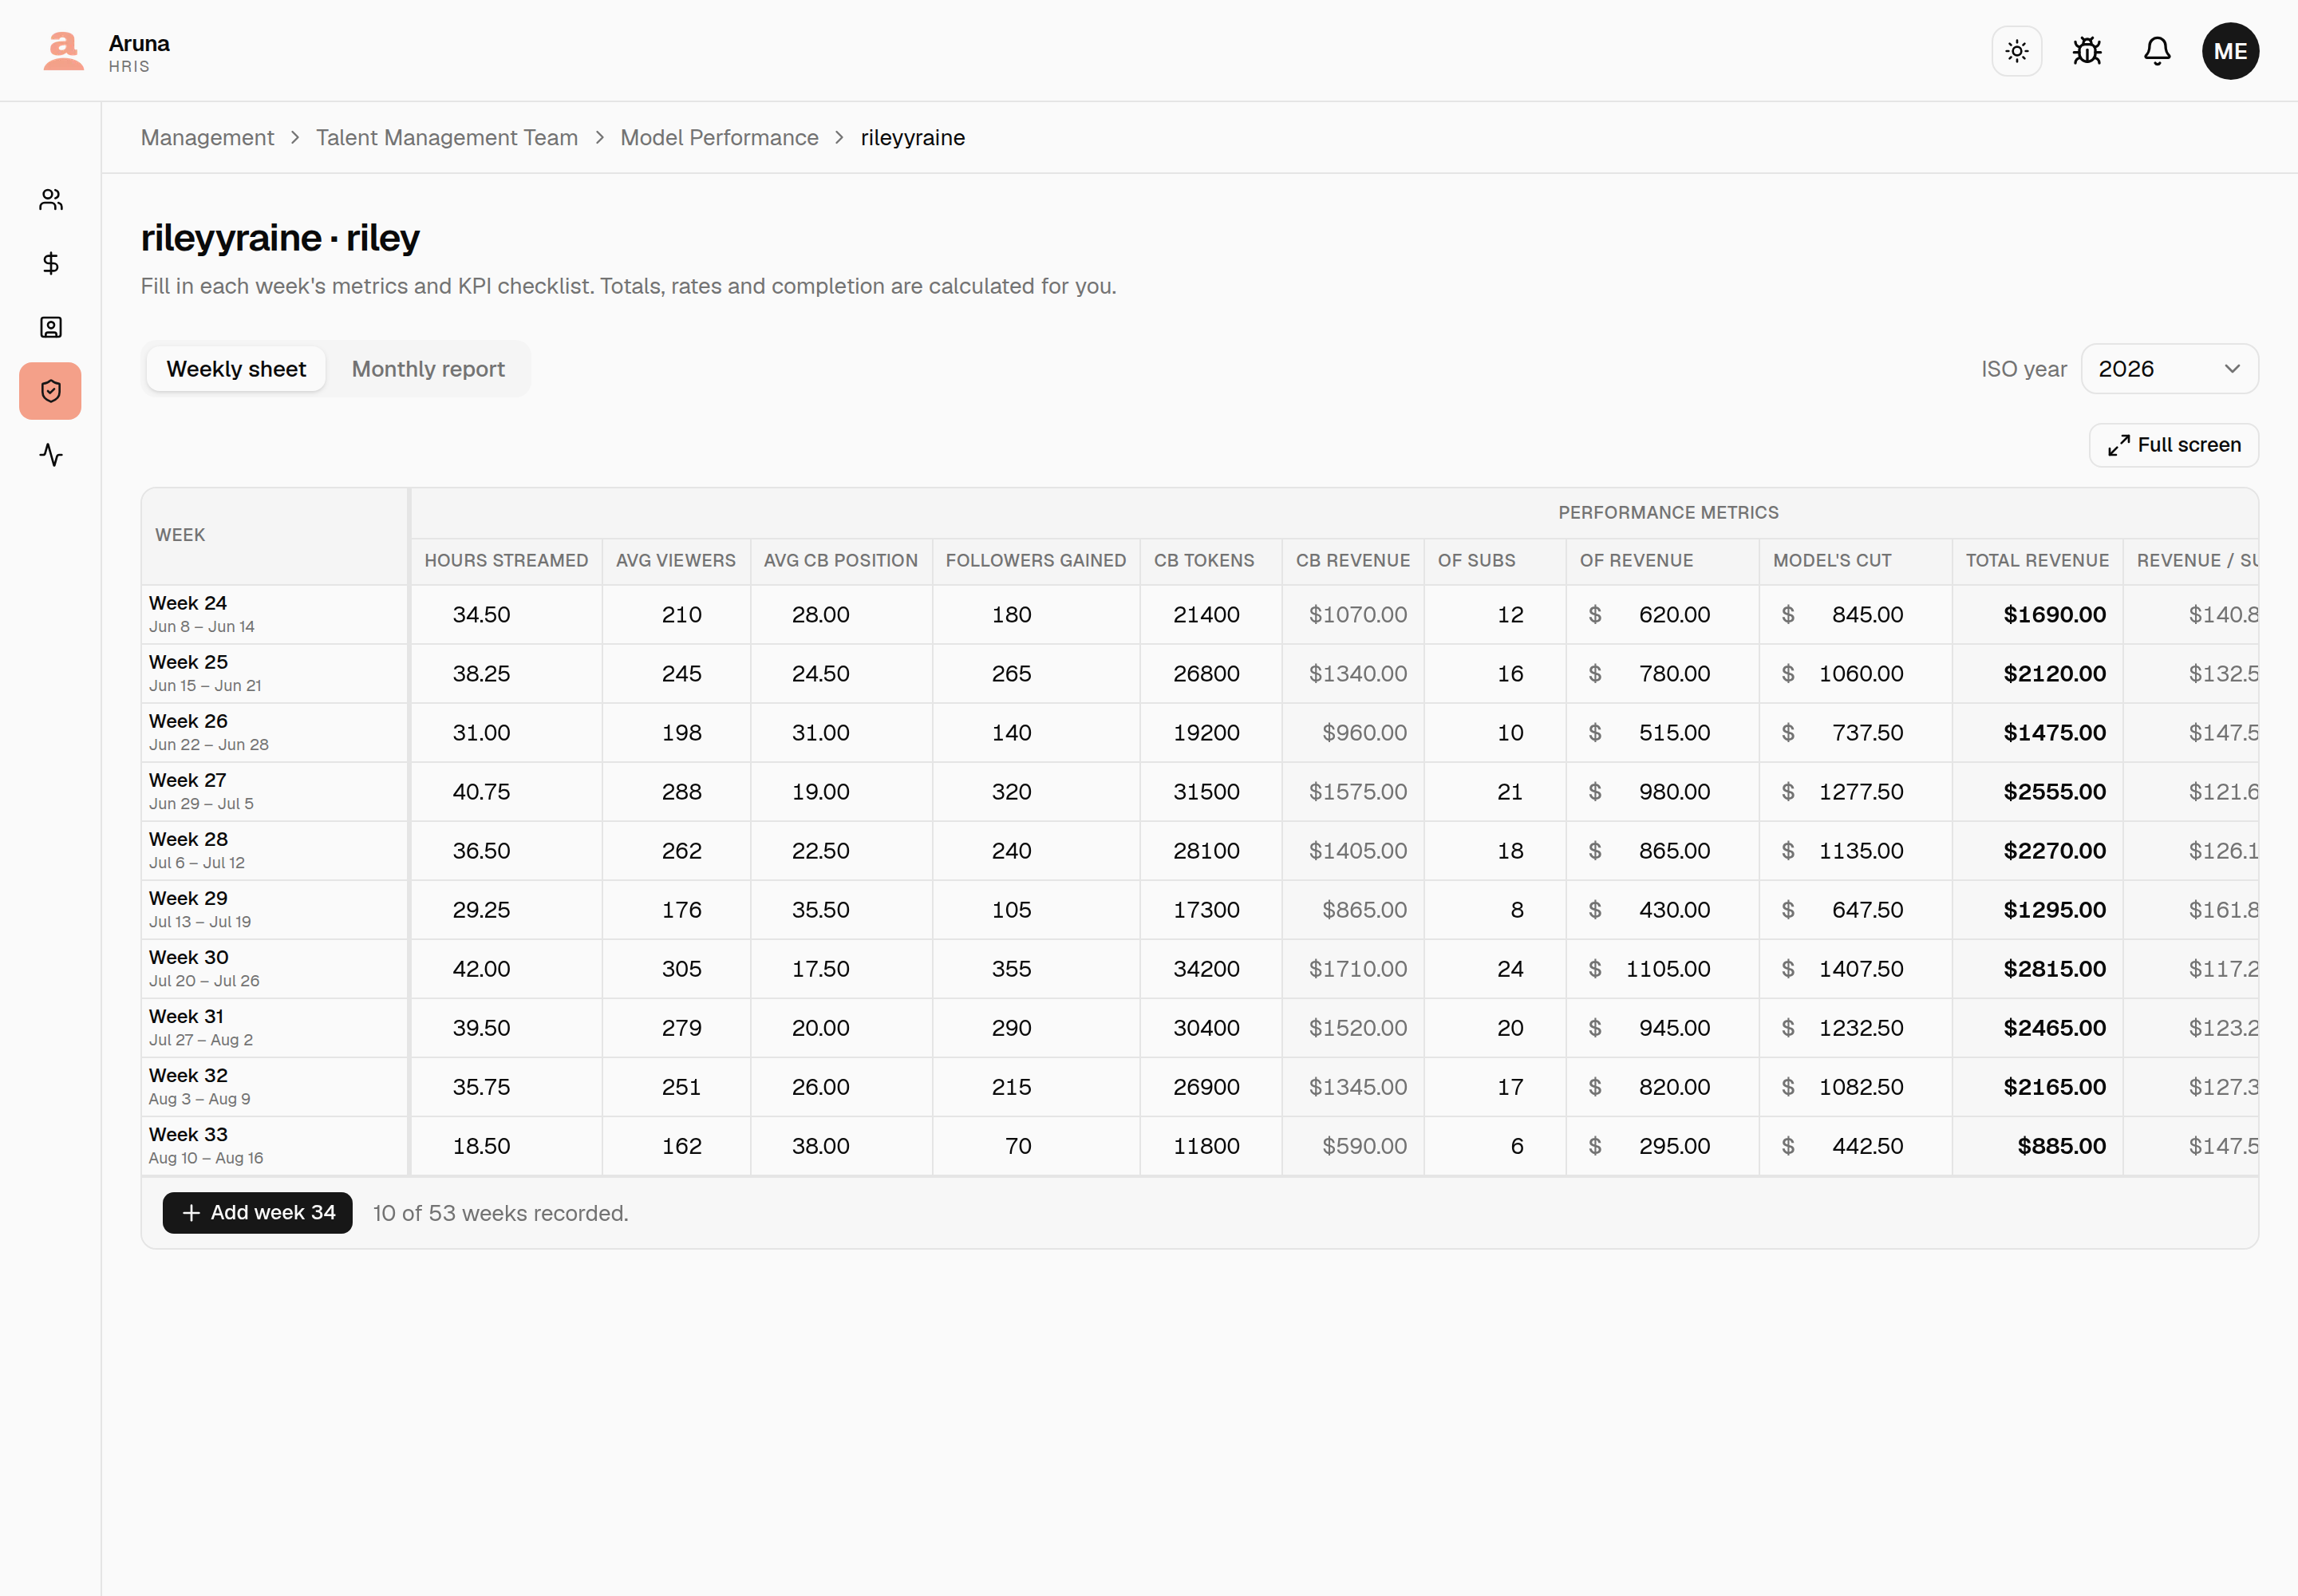
The sheet is grouped into three sections that scroll together: Performance Metrics, KPI Targets, and Customs.
Filling in a week
Click any cell and type. There's no edit mode and no Save button:
- The value saves when you leave the cell — press Tab, Enter, or click away.
- Press Esc to abandon an edit.
- If a save fails, the cell puts back its old value and tells you. What you see is always what's stored.
- Clicking a filled cell selects the whole value, so typing replaces it rather than inserting into the middle of it.
Adding weeks
+ Add week N sits at the bottom of the table, as the last row. It appends the next week — you don't choose the number, so weeks can't be skipped or duplicated.
Starting mid-year? On an empty sheet, a Start at week box appears next to the button with the dates of the week you type. Use it when a model joined partway through the year, so the sheet begins where they did instead of carrying 23 blank weeks.
Columns you can't type in
Six columns are computed. They sit on a shaded background, header included, so a worked-out column never looks like an input you forgot to fill:
| Column | How it's derived |
|---|---|
| CB revenue | CB tokens × the Chaturbate token rate |
| Total revenue | CB revenue + OF revenue |
| Revenue / sub | Total revenue ÷ OF subs |
| Rate / hour | Total revenue ÷ hours streamed |
| Completion | The week's KPI actuals ÷ the KPI targets |
| Avg price (Customs) | Customs total ÷ customs count |
If one of these looks wrong, the fix is in the figure it comes from — CB revenue follows the token count, not the other way round.
Completion is not capped at 100%. A model who beats the targets shows above it — that's information, and clipping it would hide the best weeks.
Customs
The third group records custom content sold that week: how many, and what they came to in total. Avg price works itself out from the two.
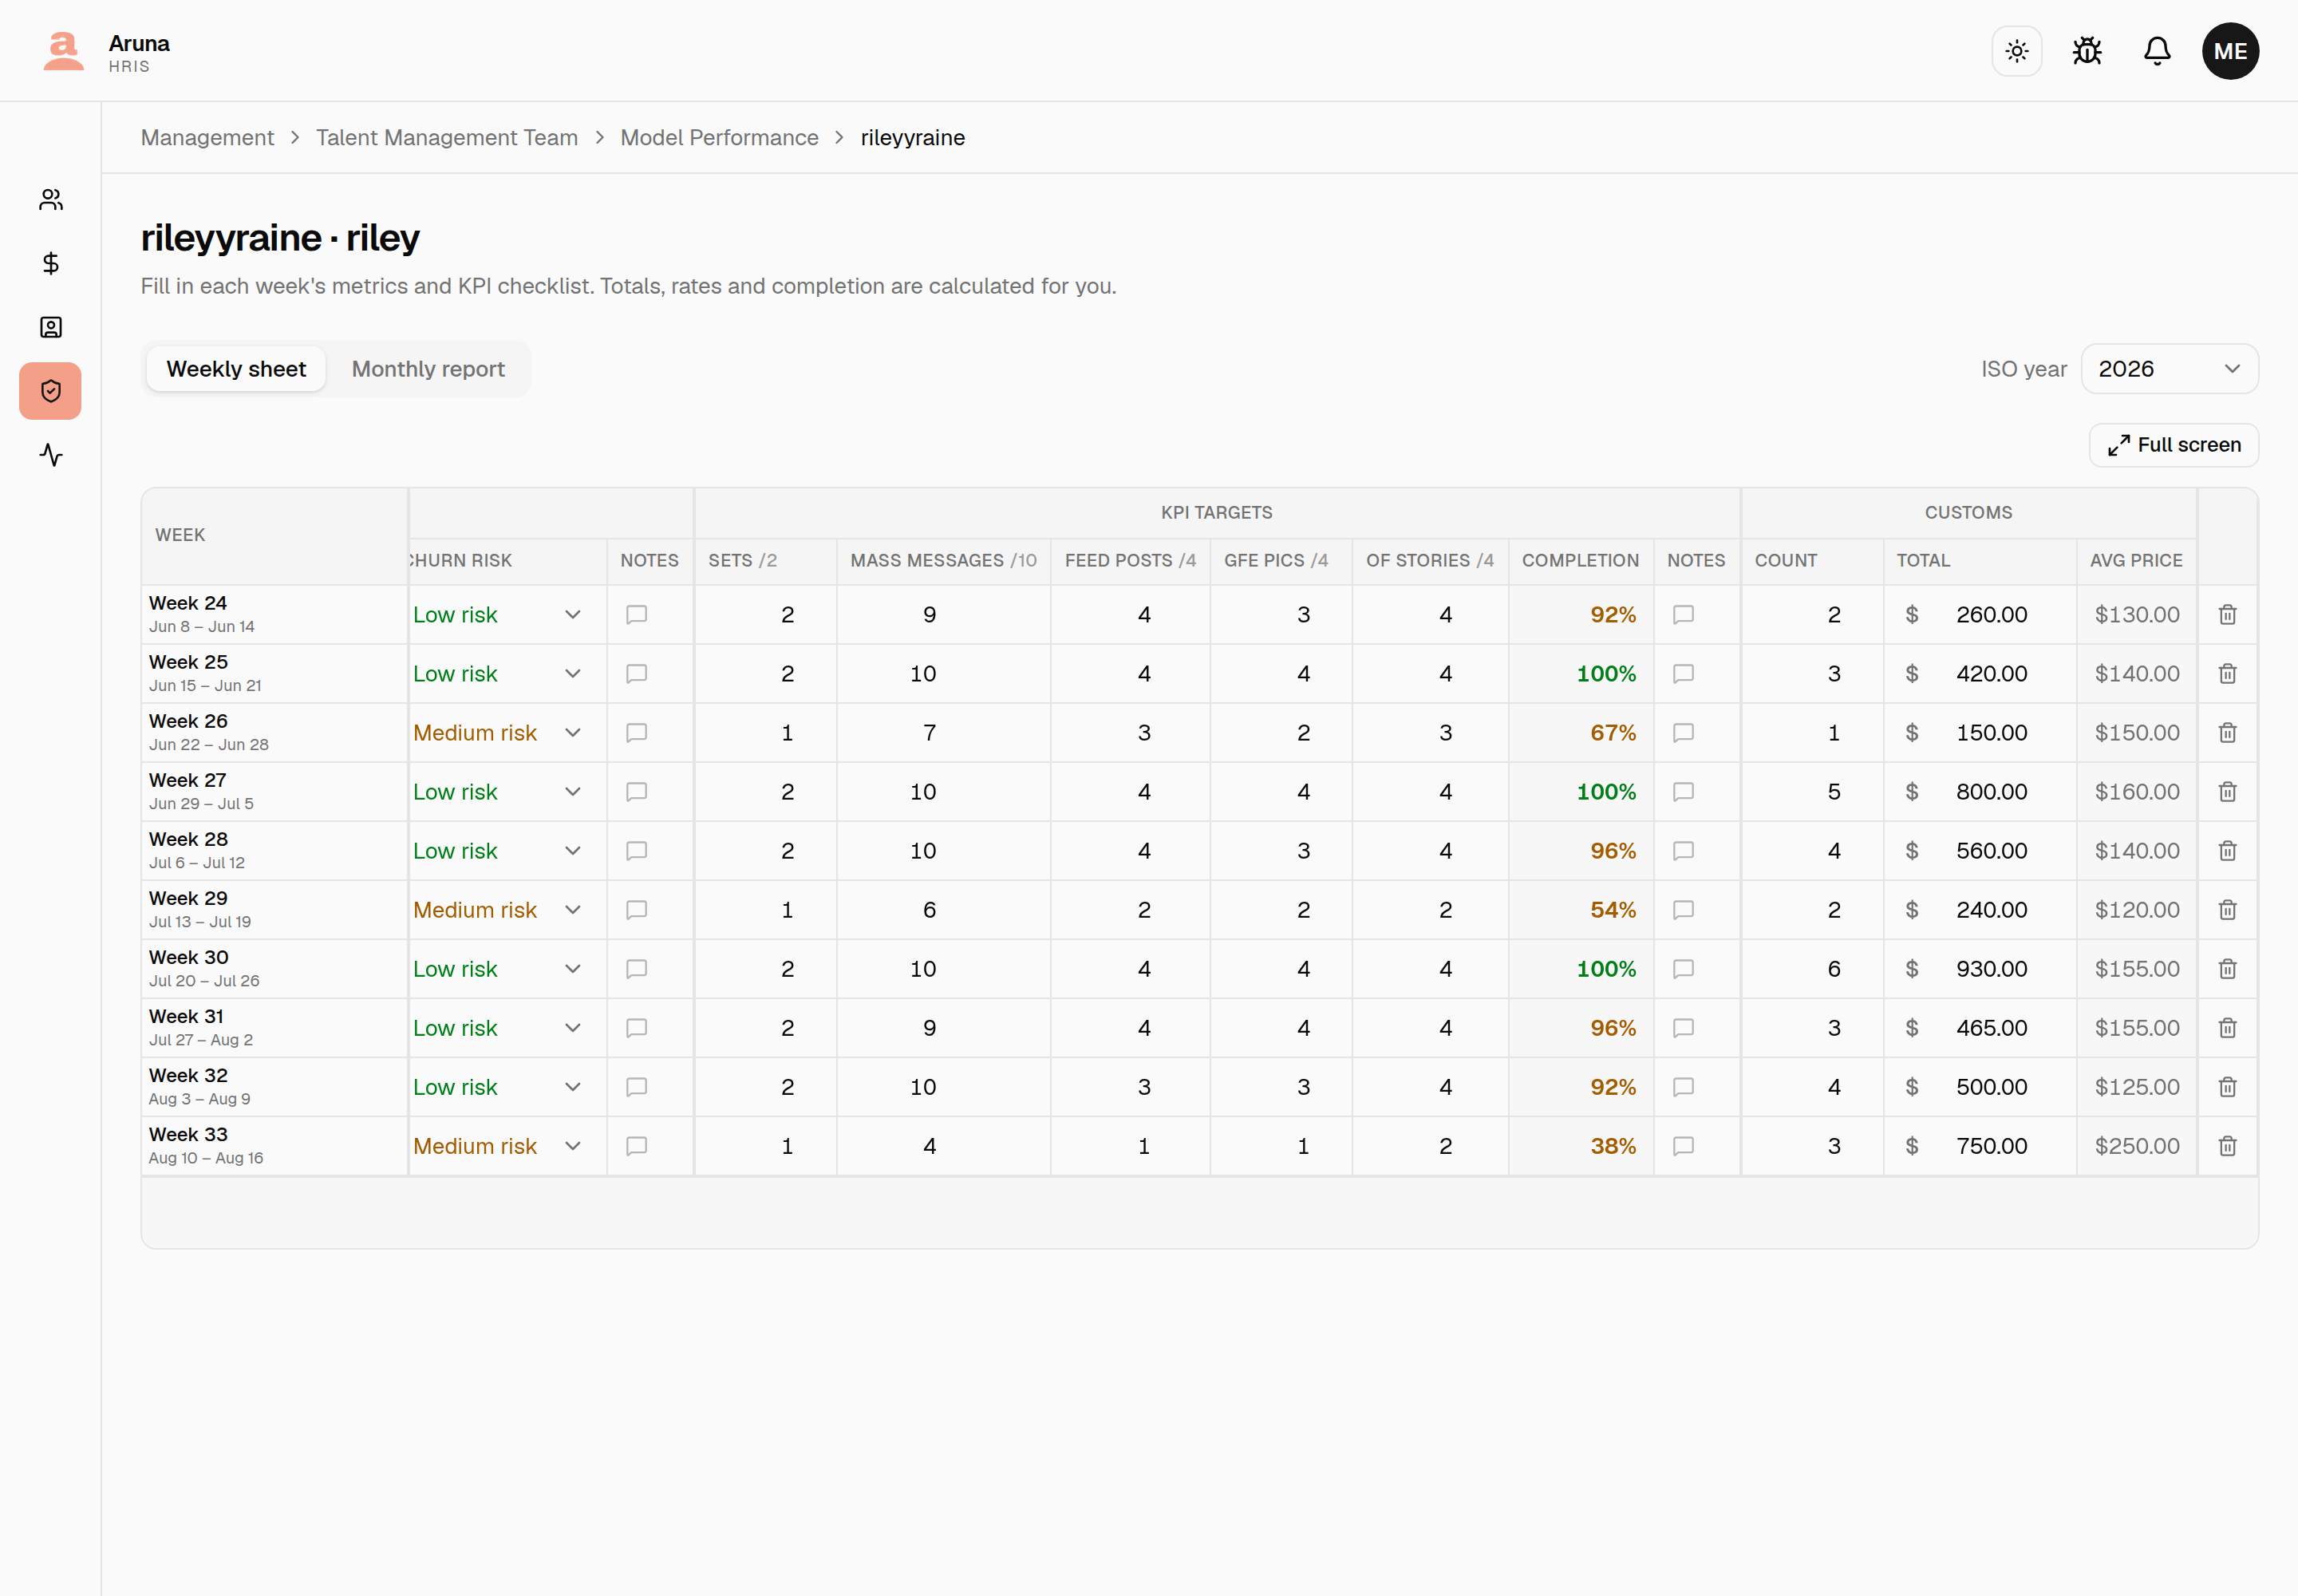
Customs sit outside the revenue totals on purpose. Total revenue, Revenue / sub and Rate / hour stay CB + OF only, so adding customs never quietly moves a figure that has already been reported. They're also absent from the monthly PDF — for now this is a record you keep, not something the model sees.
Full screen
The sheet is ~25 columns wide. Full screen hides the app chrome and gives the table the whole window; the Week column stays pinned while the rest scrolls.
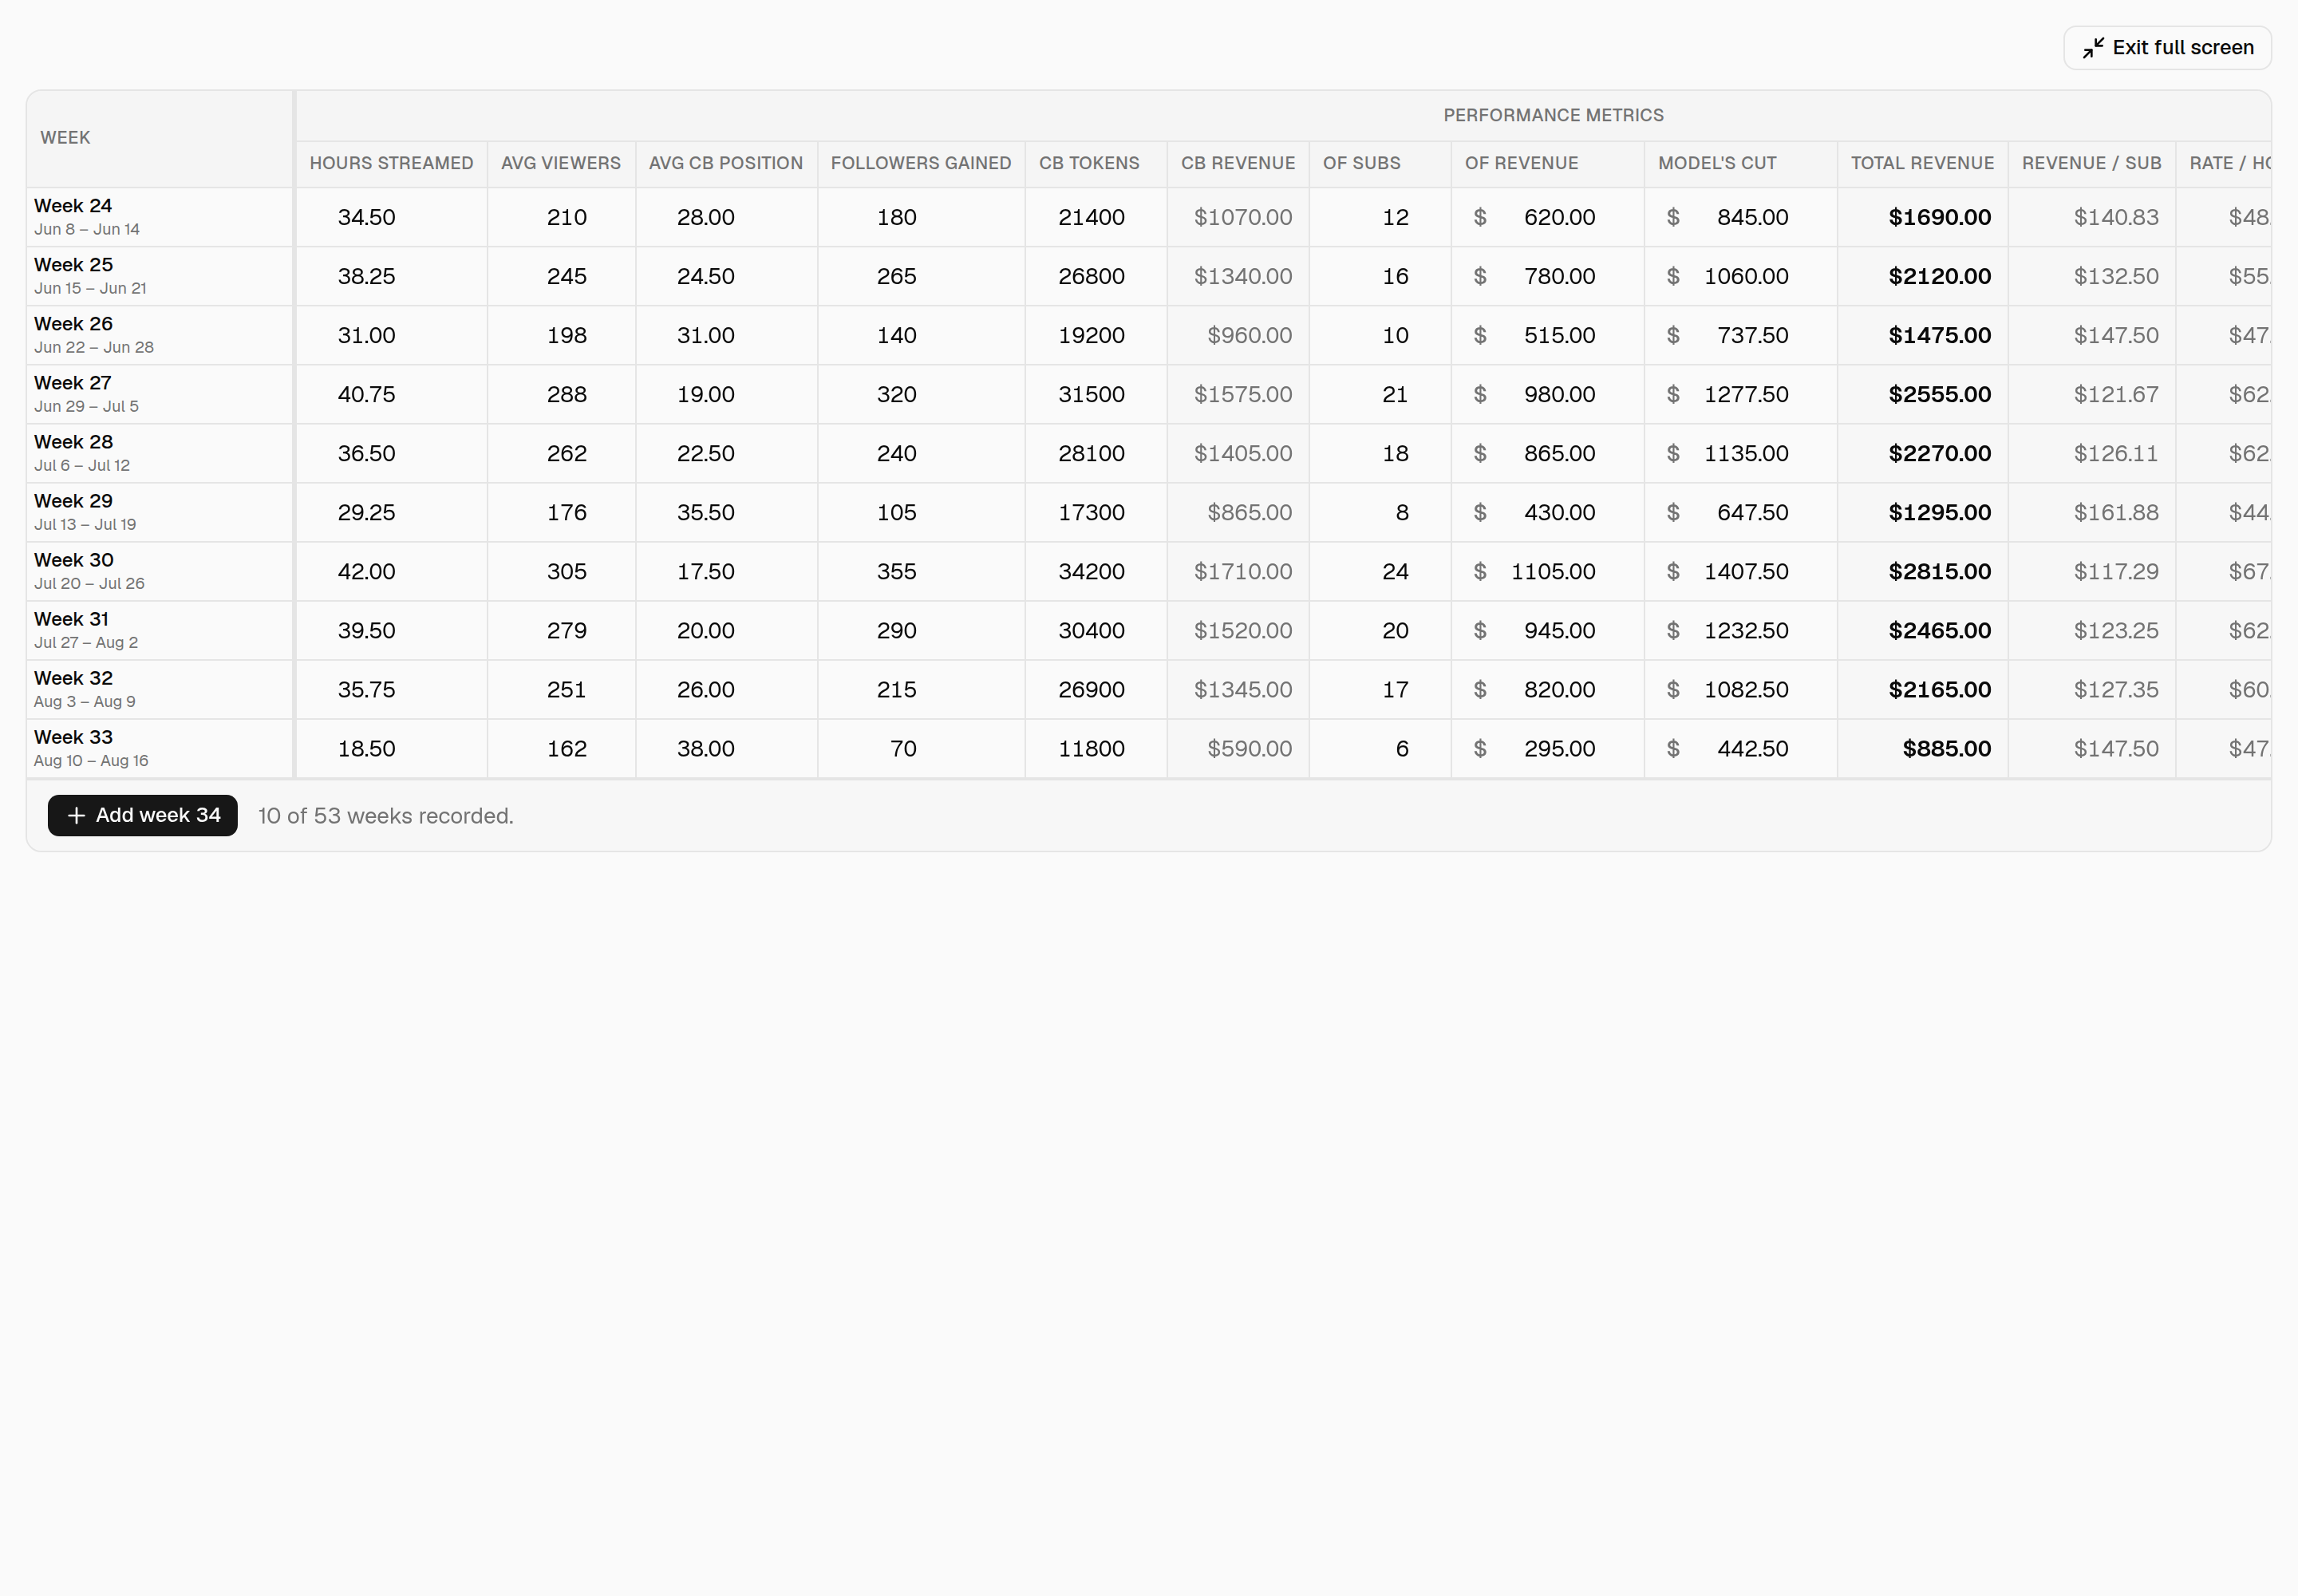
Full screen is held in the URL, so it survives a refresh and you can send someone a link that opens this way.
Weekly KPI targets
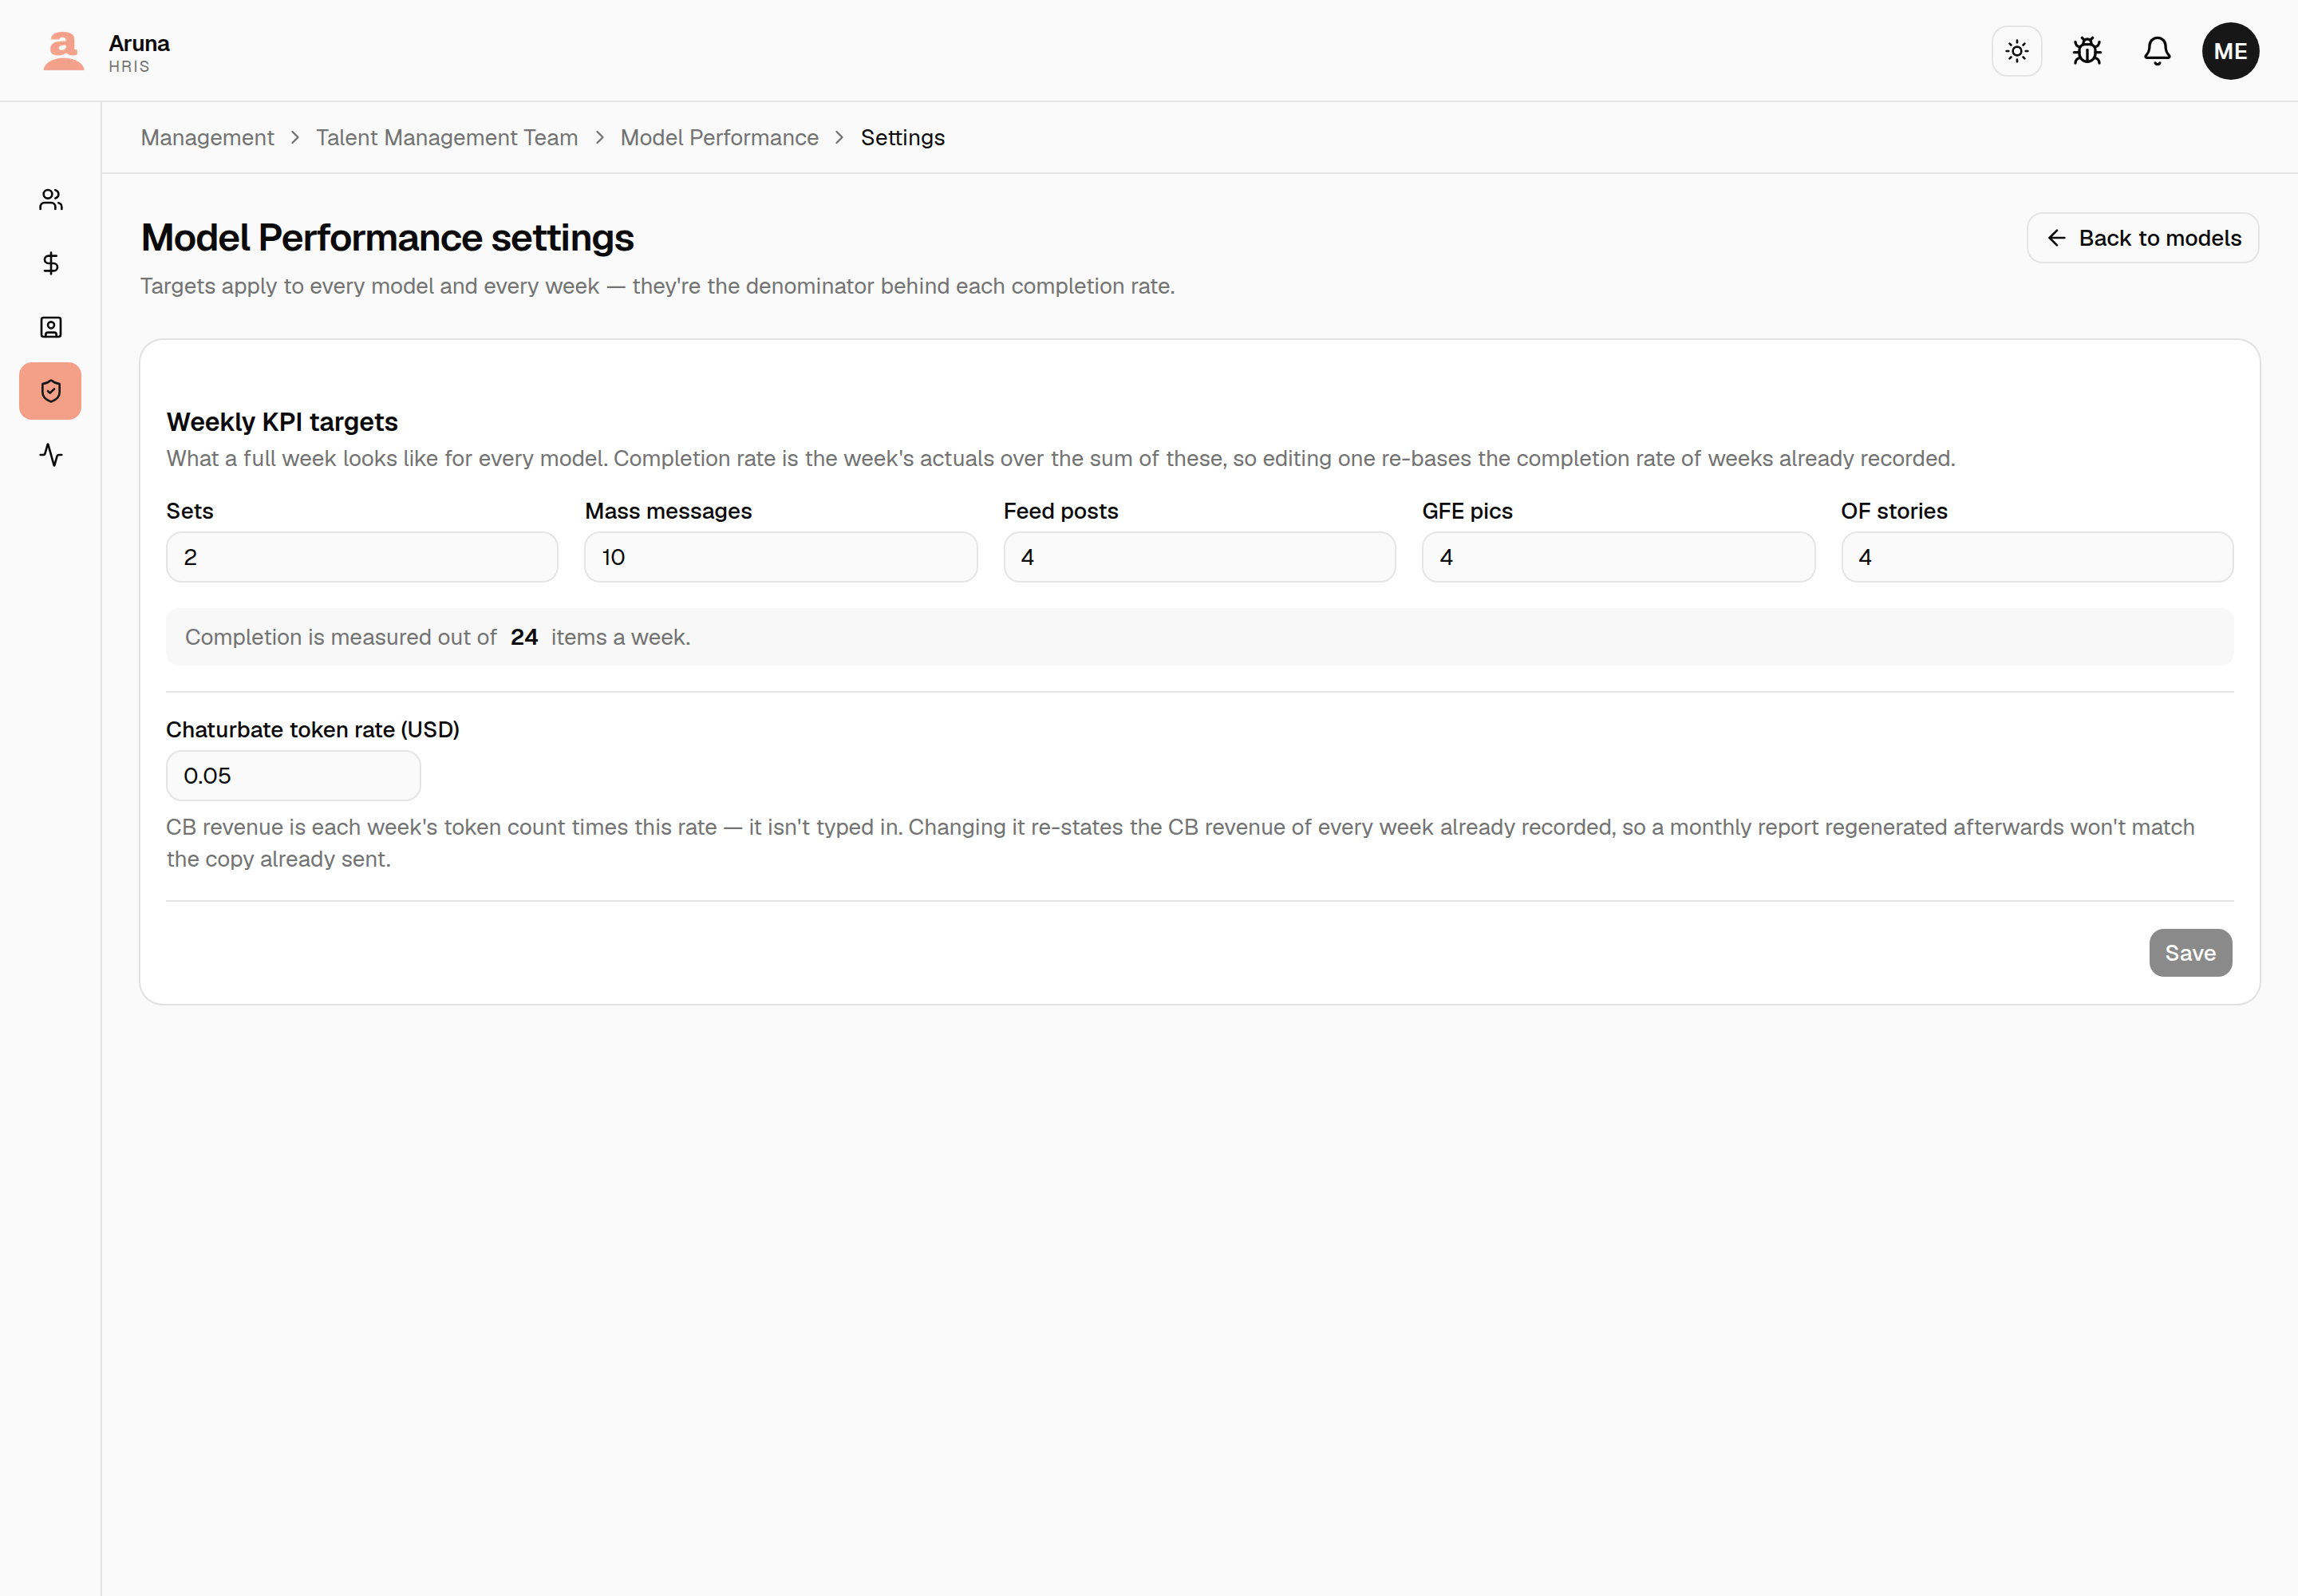
The Settings button on the index opens the targets. These are the denominator behind every completion rate.
Editing a target re-bases history
Targets are not frozen onto each week. They apply to every model and every week, including weeks already recorded and already reported. Raise Mass messages from 10 to 12 and every past completion rate drops.
That's deliberate — a KPI target is current policy, not a fact about a week that has been and gone. But change one knowing that last month's numbers will move.
Targets are system-wide: one set for all models, not per model.
The Chaturbate token rate
The same page carries the token rate — what one CB token is worth. Every week's CB revenue is its token count times this number, which is why CB revenue isn't a cell you type.
Changing the rate re-states past revenue
Like the targets, the rate is read live rather than frozen onto each week. Change it and the CB revenue of every week already recorded moves with it — so a report regenerated afterwards won't match the copy you already sent.
The archived PDF stays the record of what actually went out.
The report
The Report tab turns the sheet into a model-facing PDF, at either of two cadences:
- Weekly — one ISO week, compared against the week before it.
- Monthly — four ISO weeks, compared against the four before.
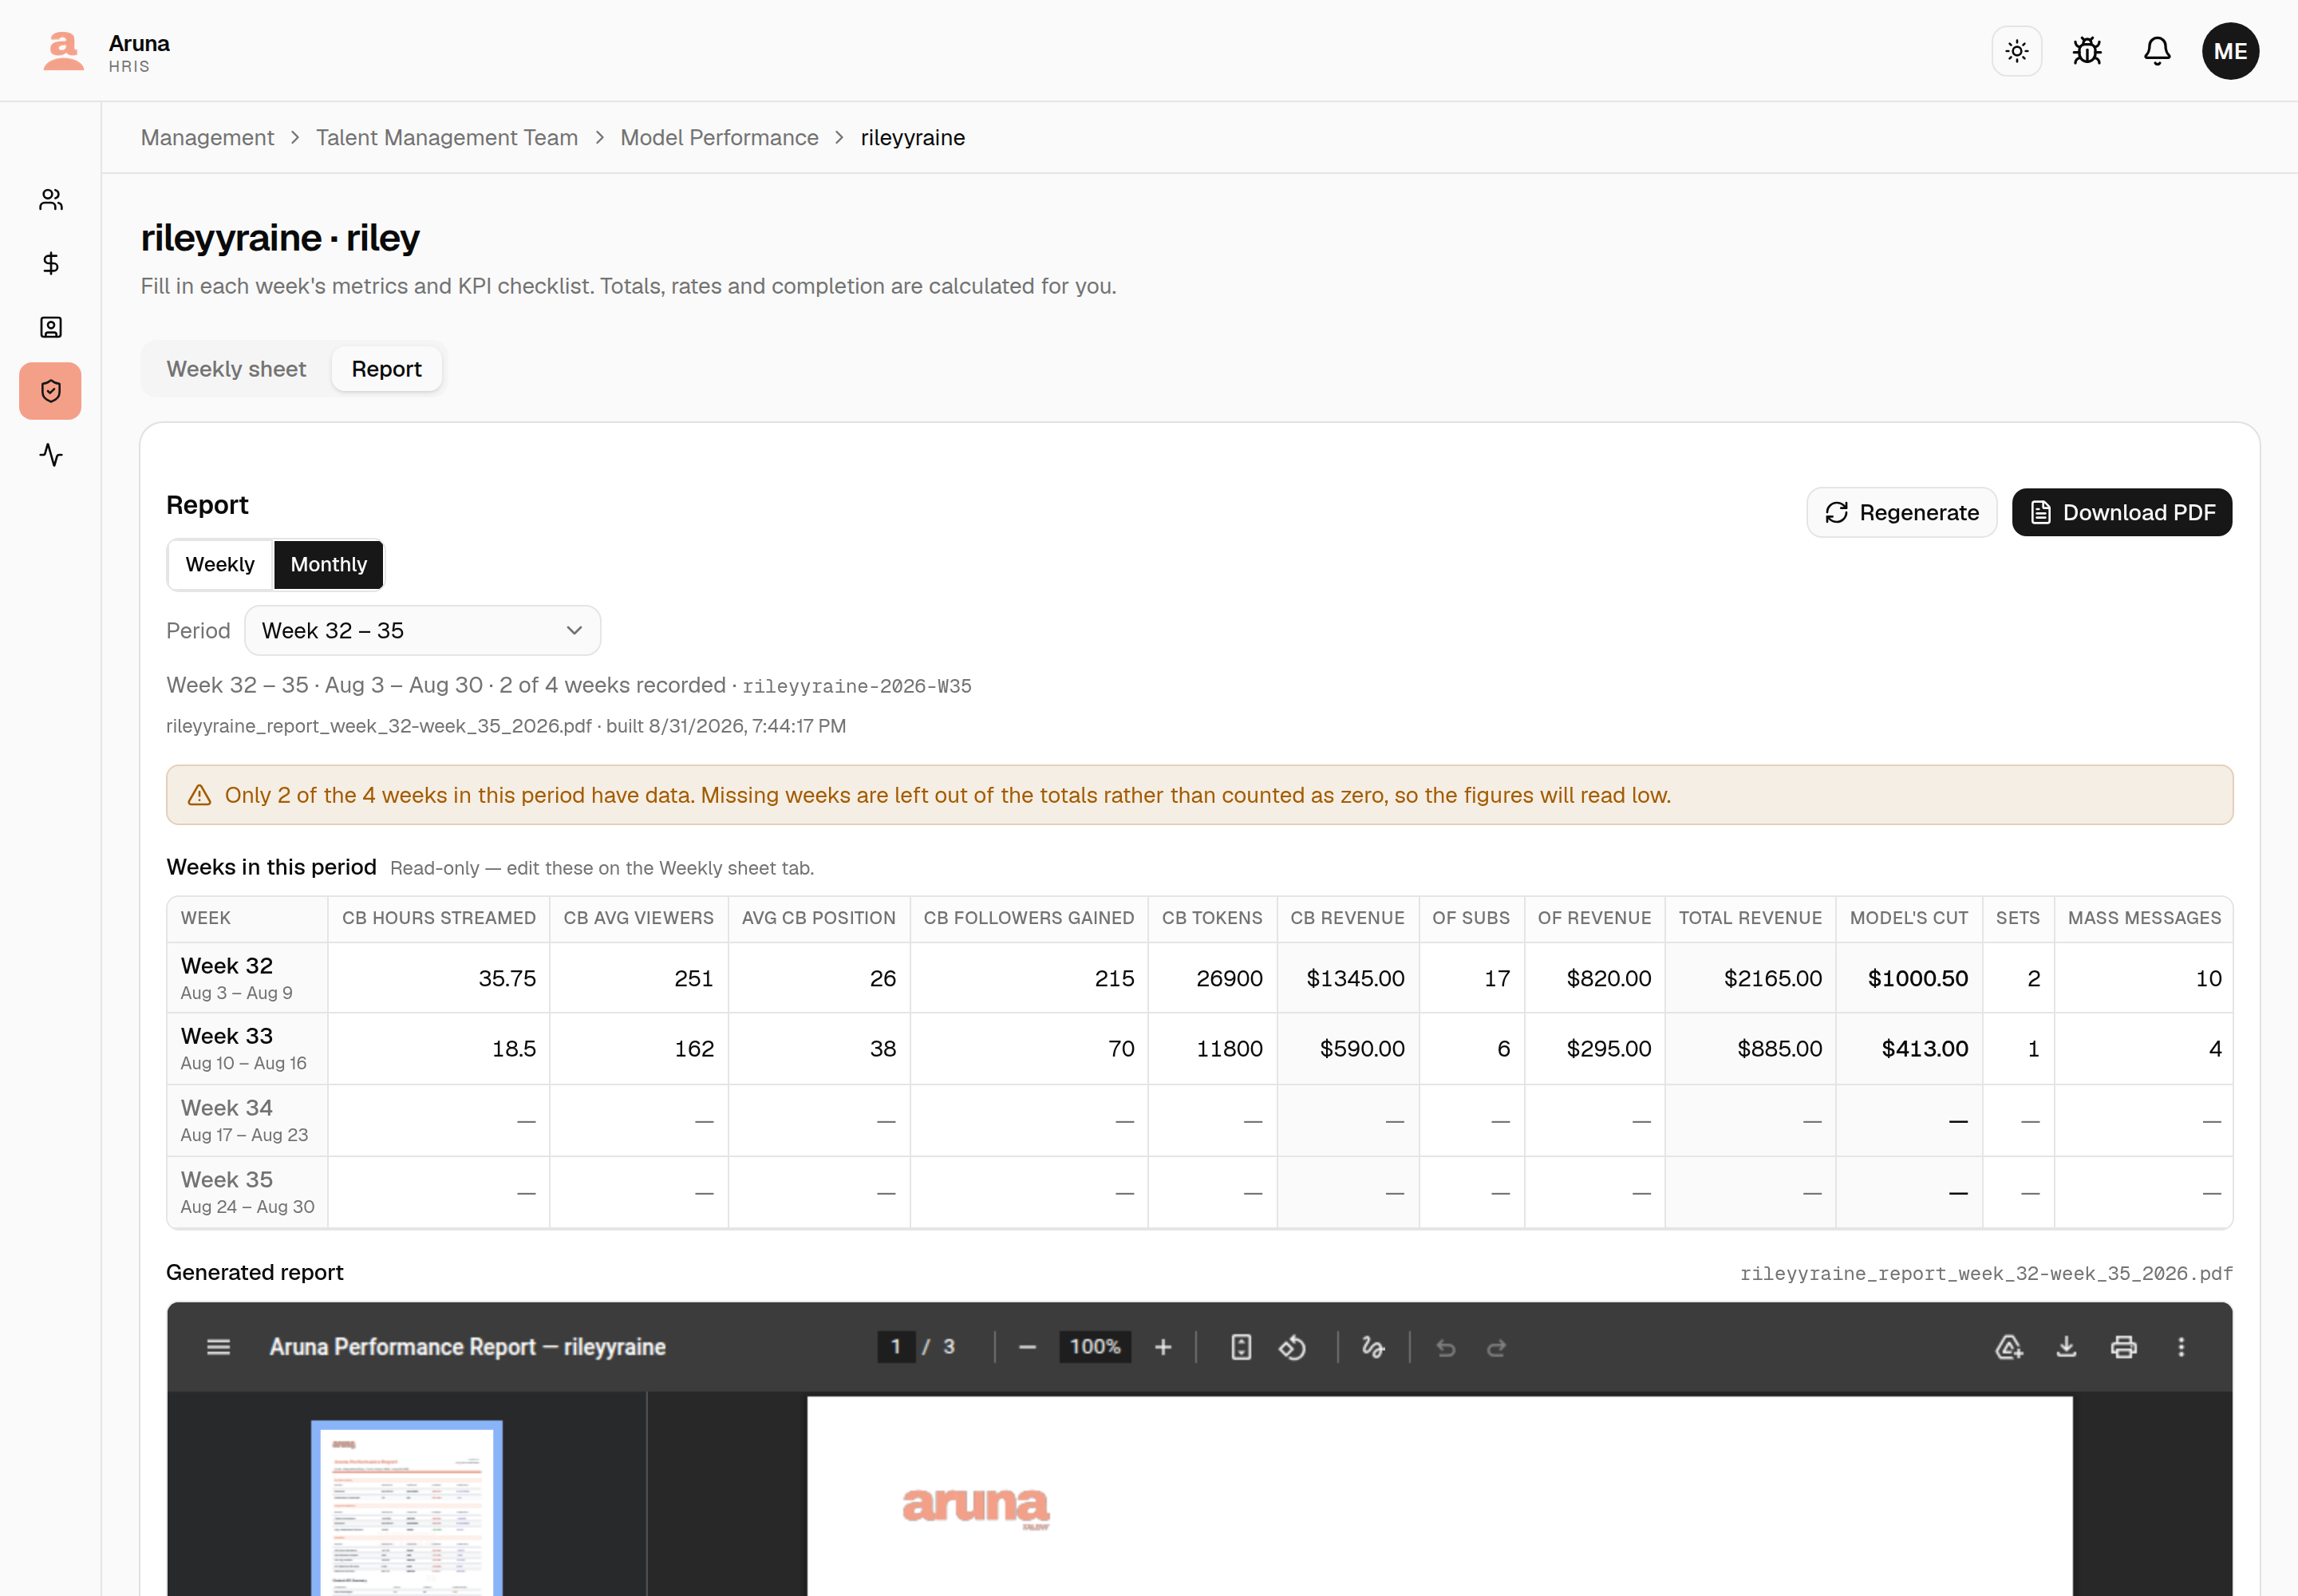
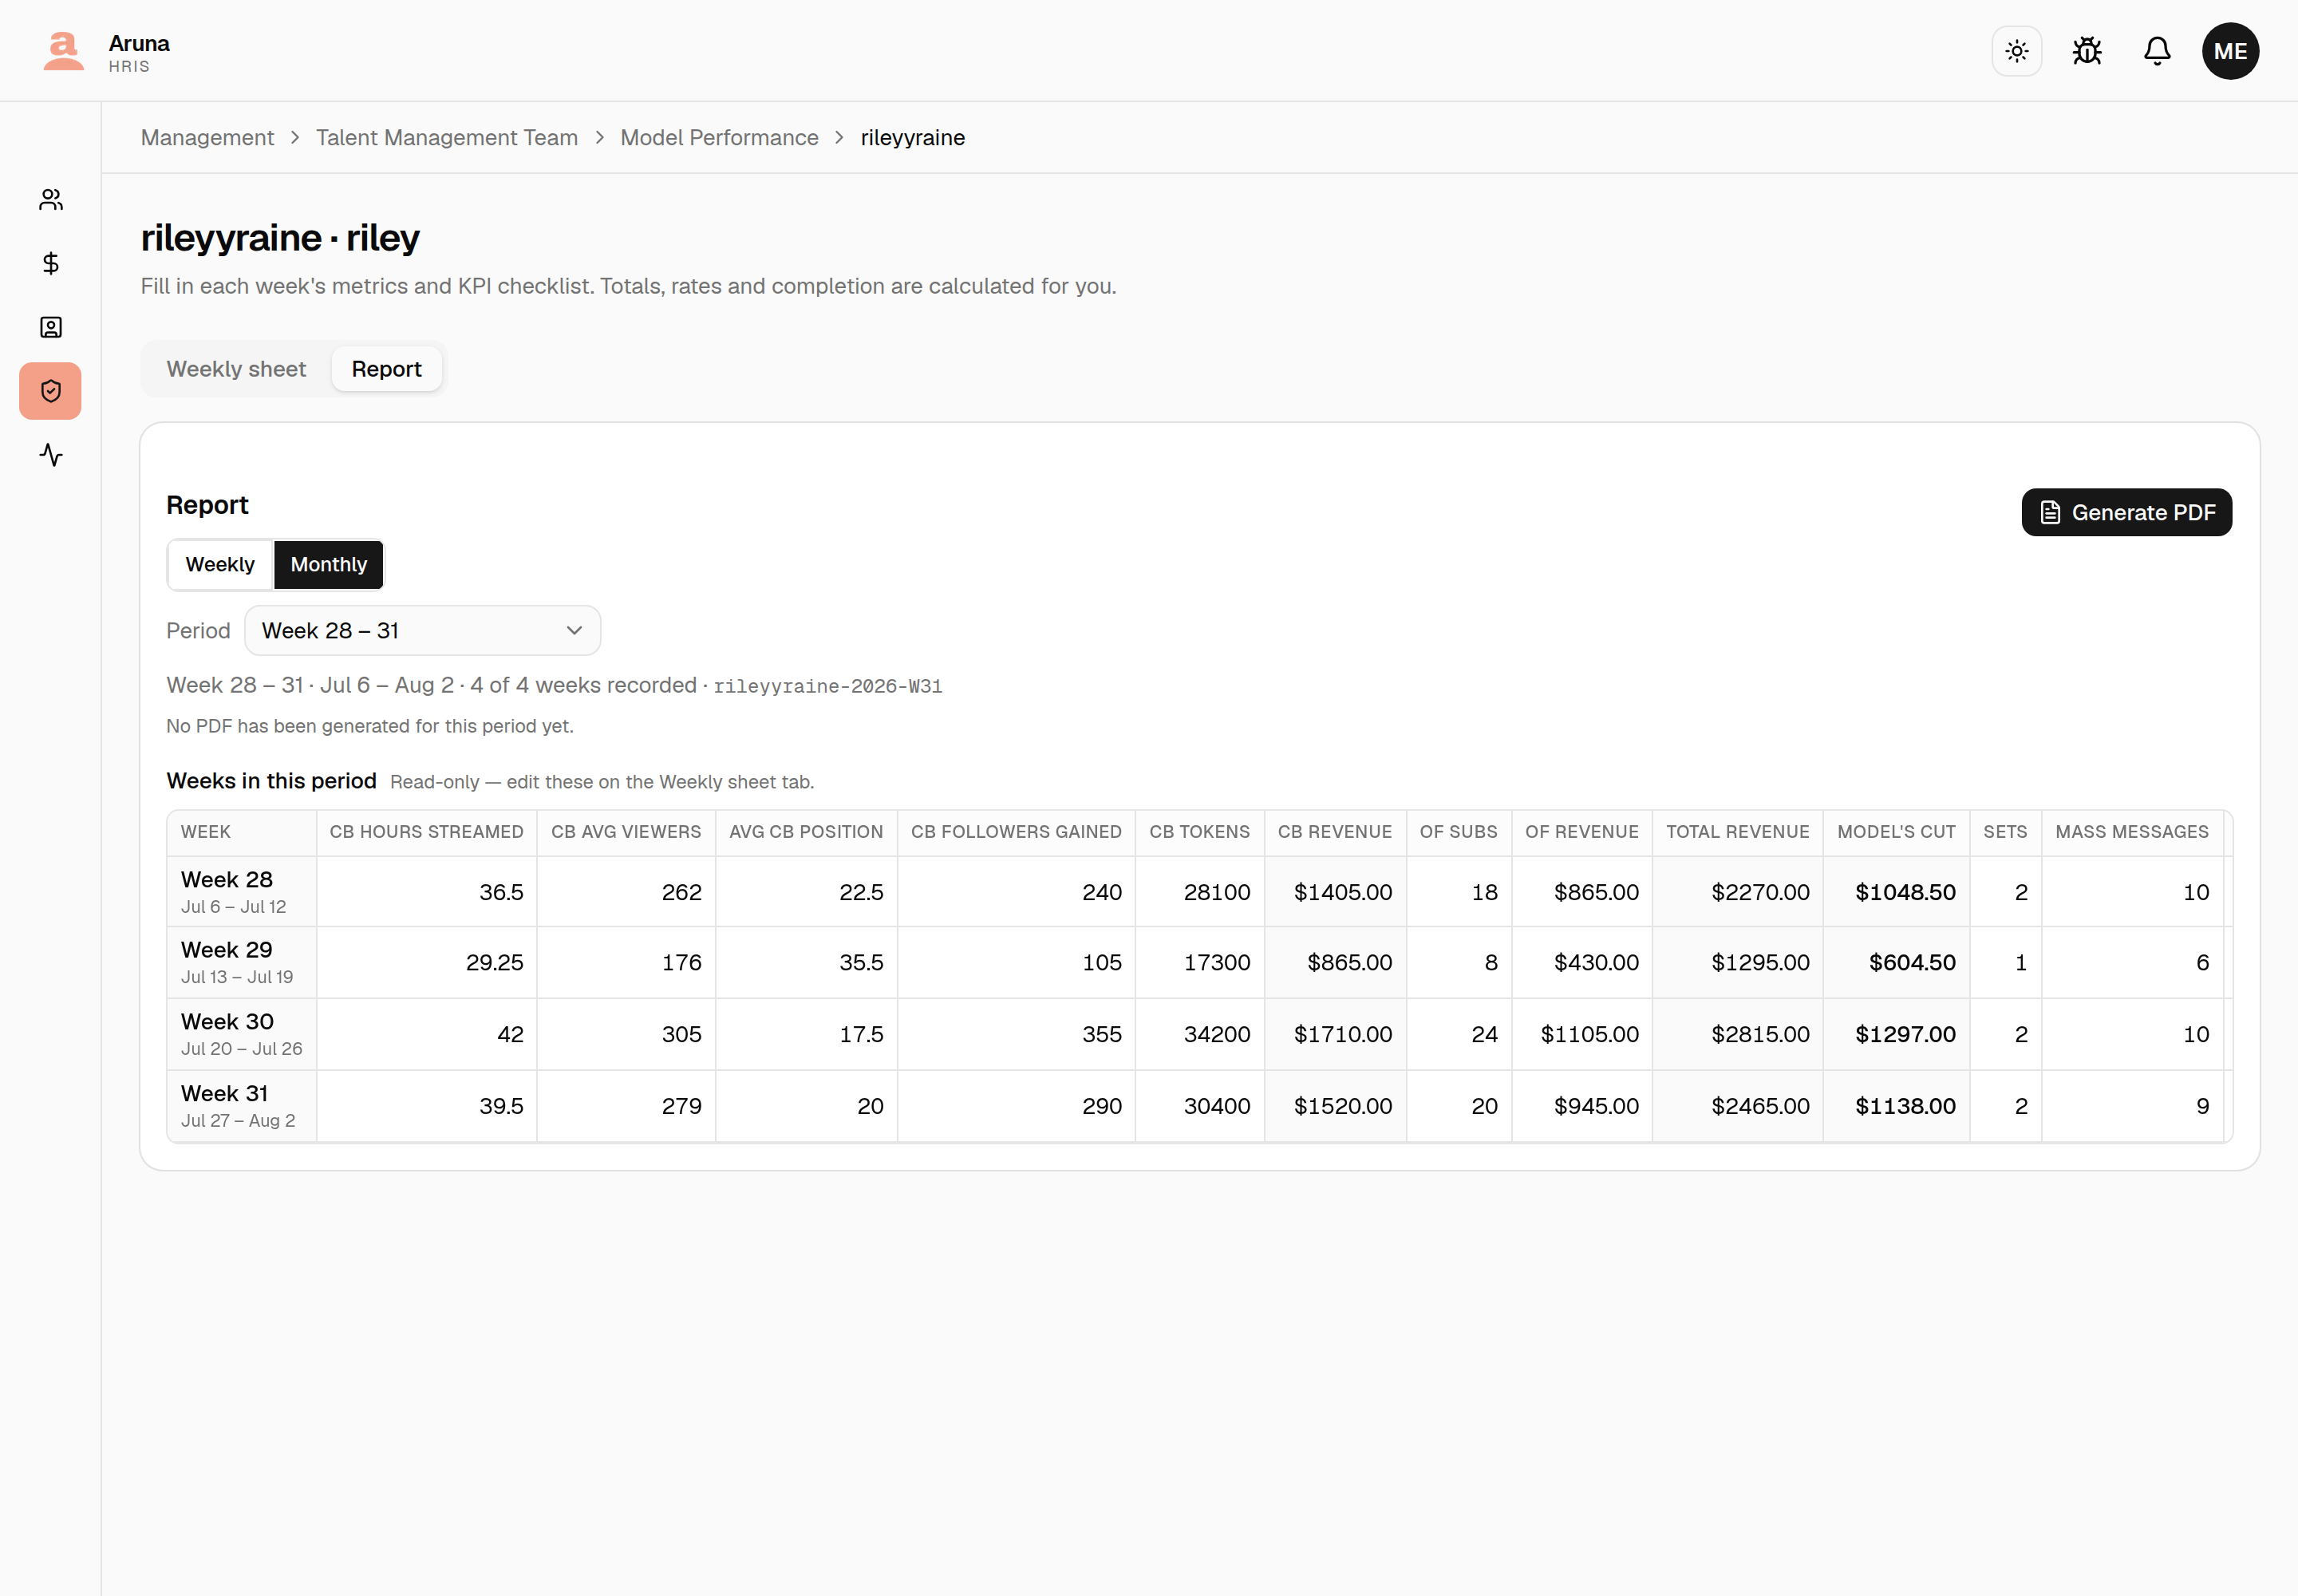
It's the same document either way; only the window length differs. Pick the cadence with the Weekly / Monthly toggle, then pick the period beneath it — switching cadence re-tiles the period list and jumps you to its newest window.
What a period is
A period is one or four complete ISO weeks, depending on the cadence. Either way the windows tile backwards — monthly gives weeks 30–33, then 26–29, then 22–25; weekly gives week 33, then 32, then 31 — so no week is counted twice and none is skipped. Each window is compared against the equally long window before it to produce the change and the forecast.
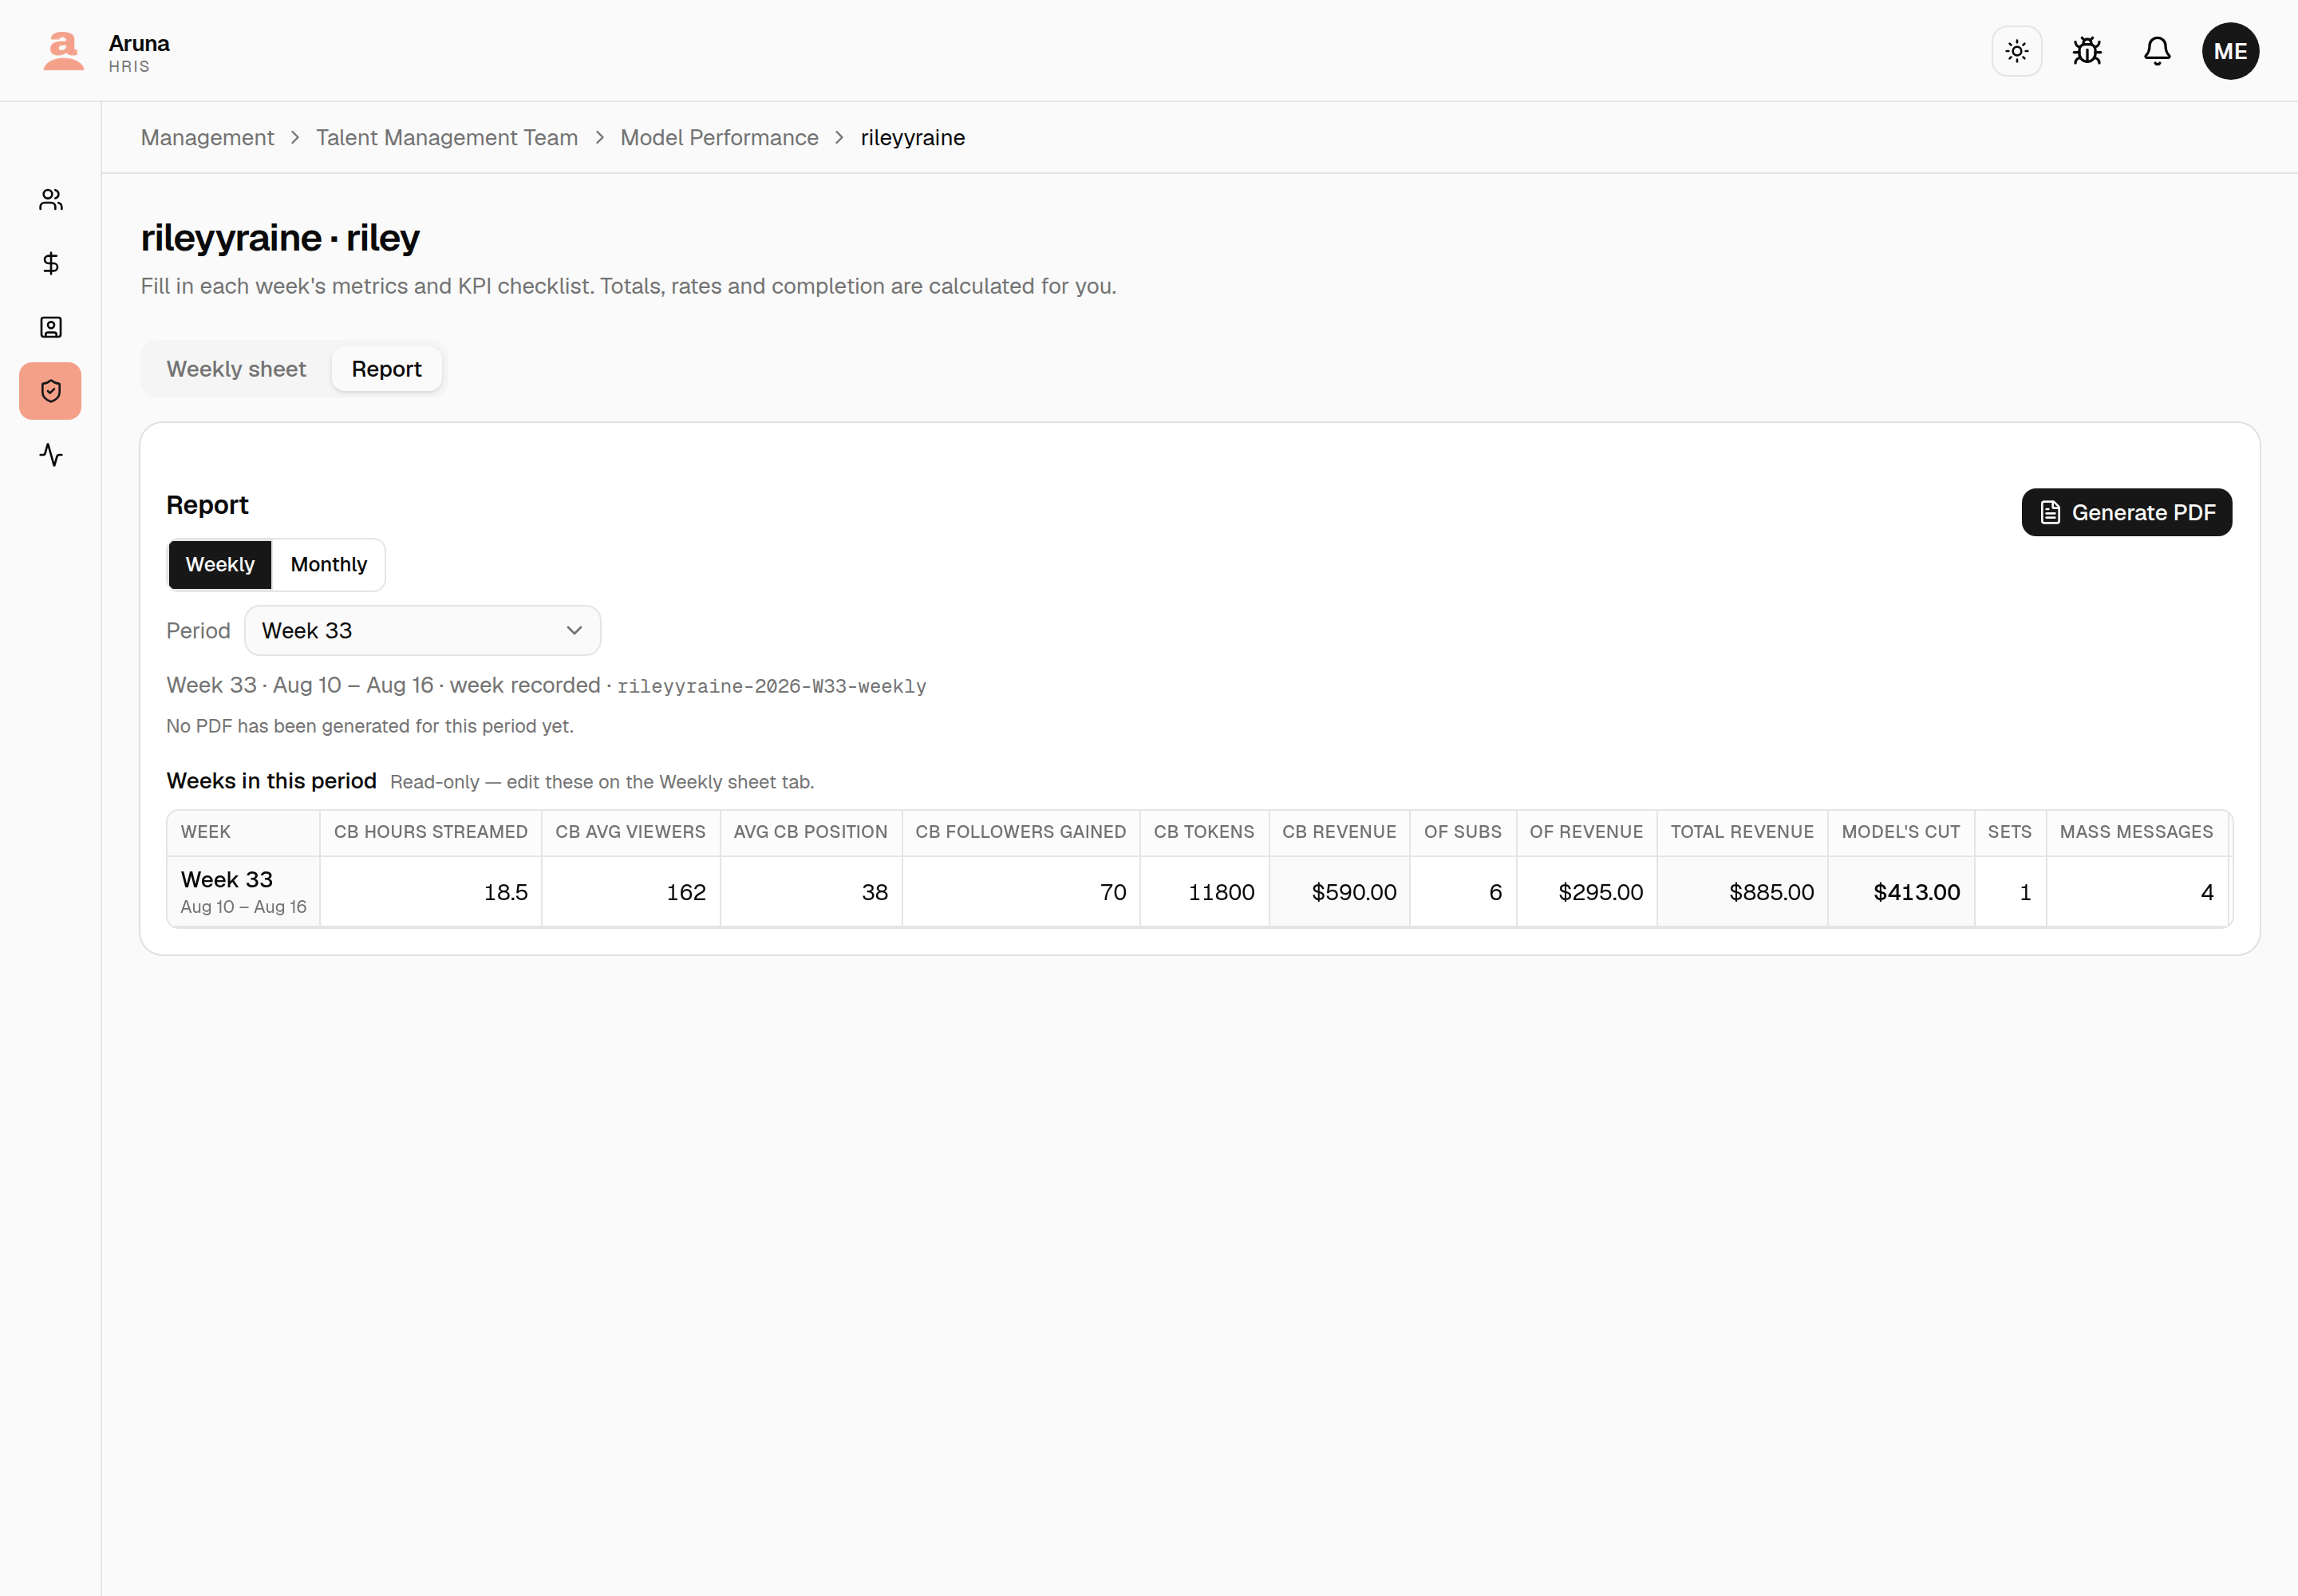
A weekly period reads as a single week ("Week 33") rather than a span.
On the Weekly cadence the same panel lists single weeks instead, and the
summary line carries a -weekly report id so the two are never confused:
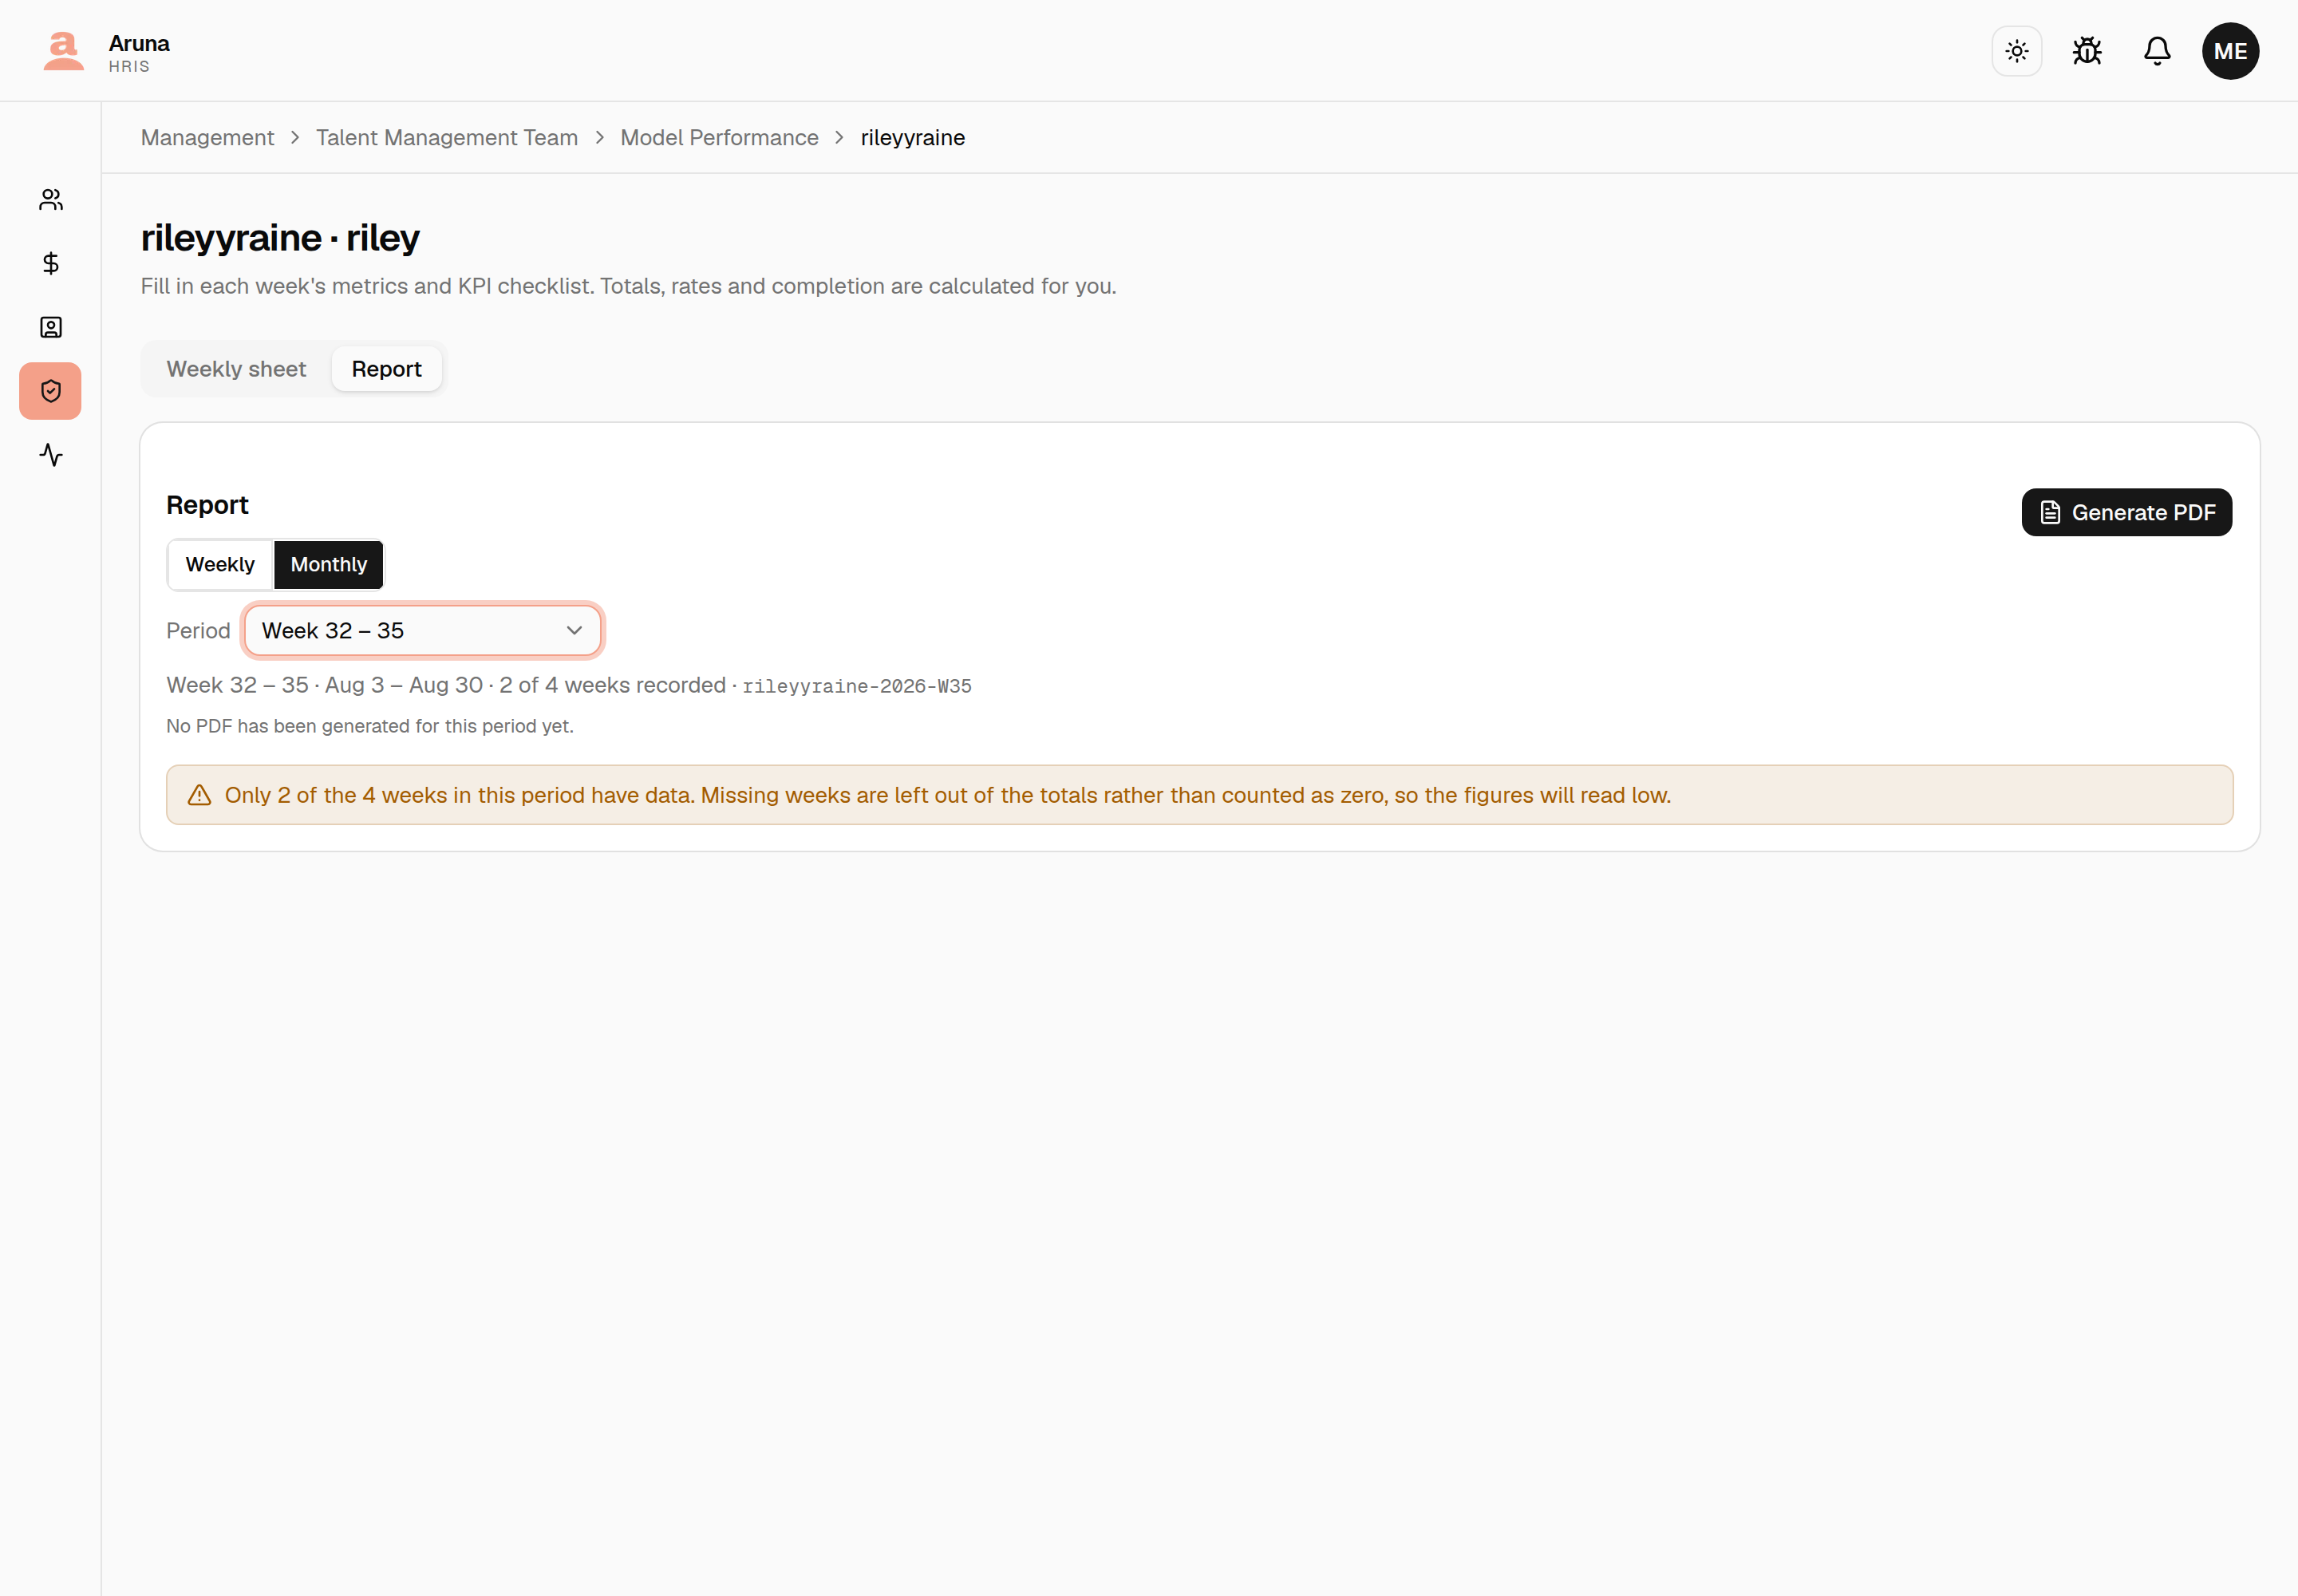
Each option reads as its week span with the dates beneath, the same way the sheet labels a row. A window that crosses the year end spells out both years.
Reports are built on demand
Nothing generates these on a schedule — you pick the cadence and period and press Generate when you actually intend to send something. The only scheduled job on this board is the Monday digest that nudges managers about missing KPI checklists.
The current week is never in a report
The newest window always ends last week. A report including the week in progress would show a half-finished figure and then contradict itself once the week closed.
What the tab shows you
Under the controls, the tab shows what the report is built from and what it became:
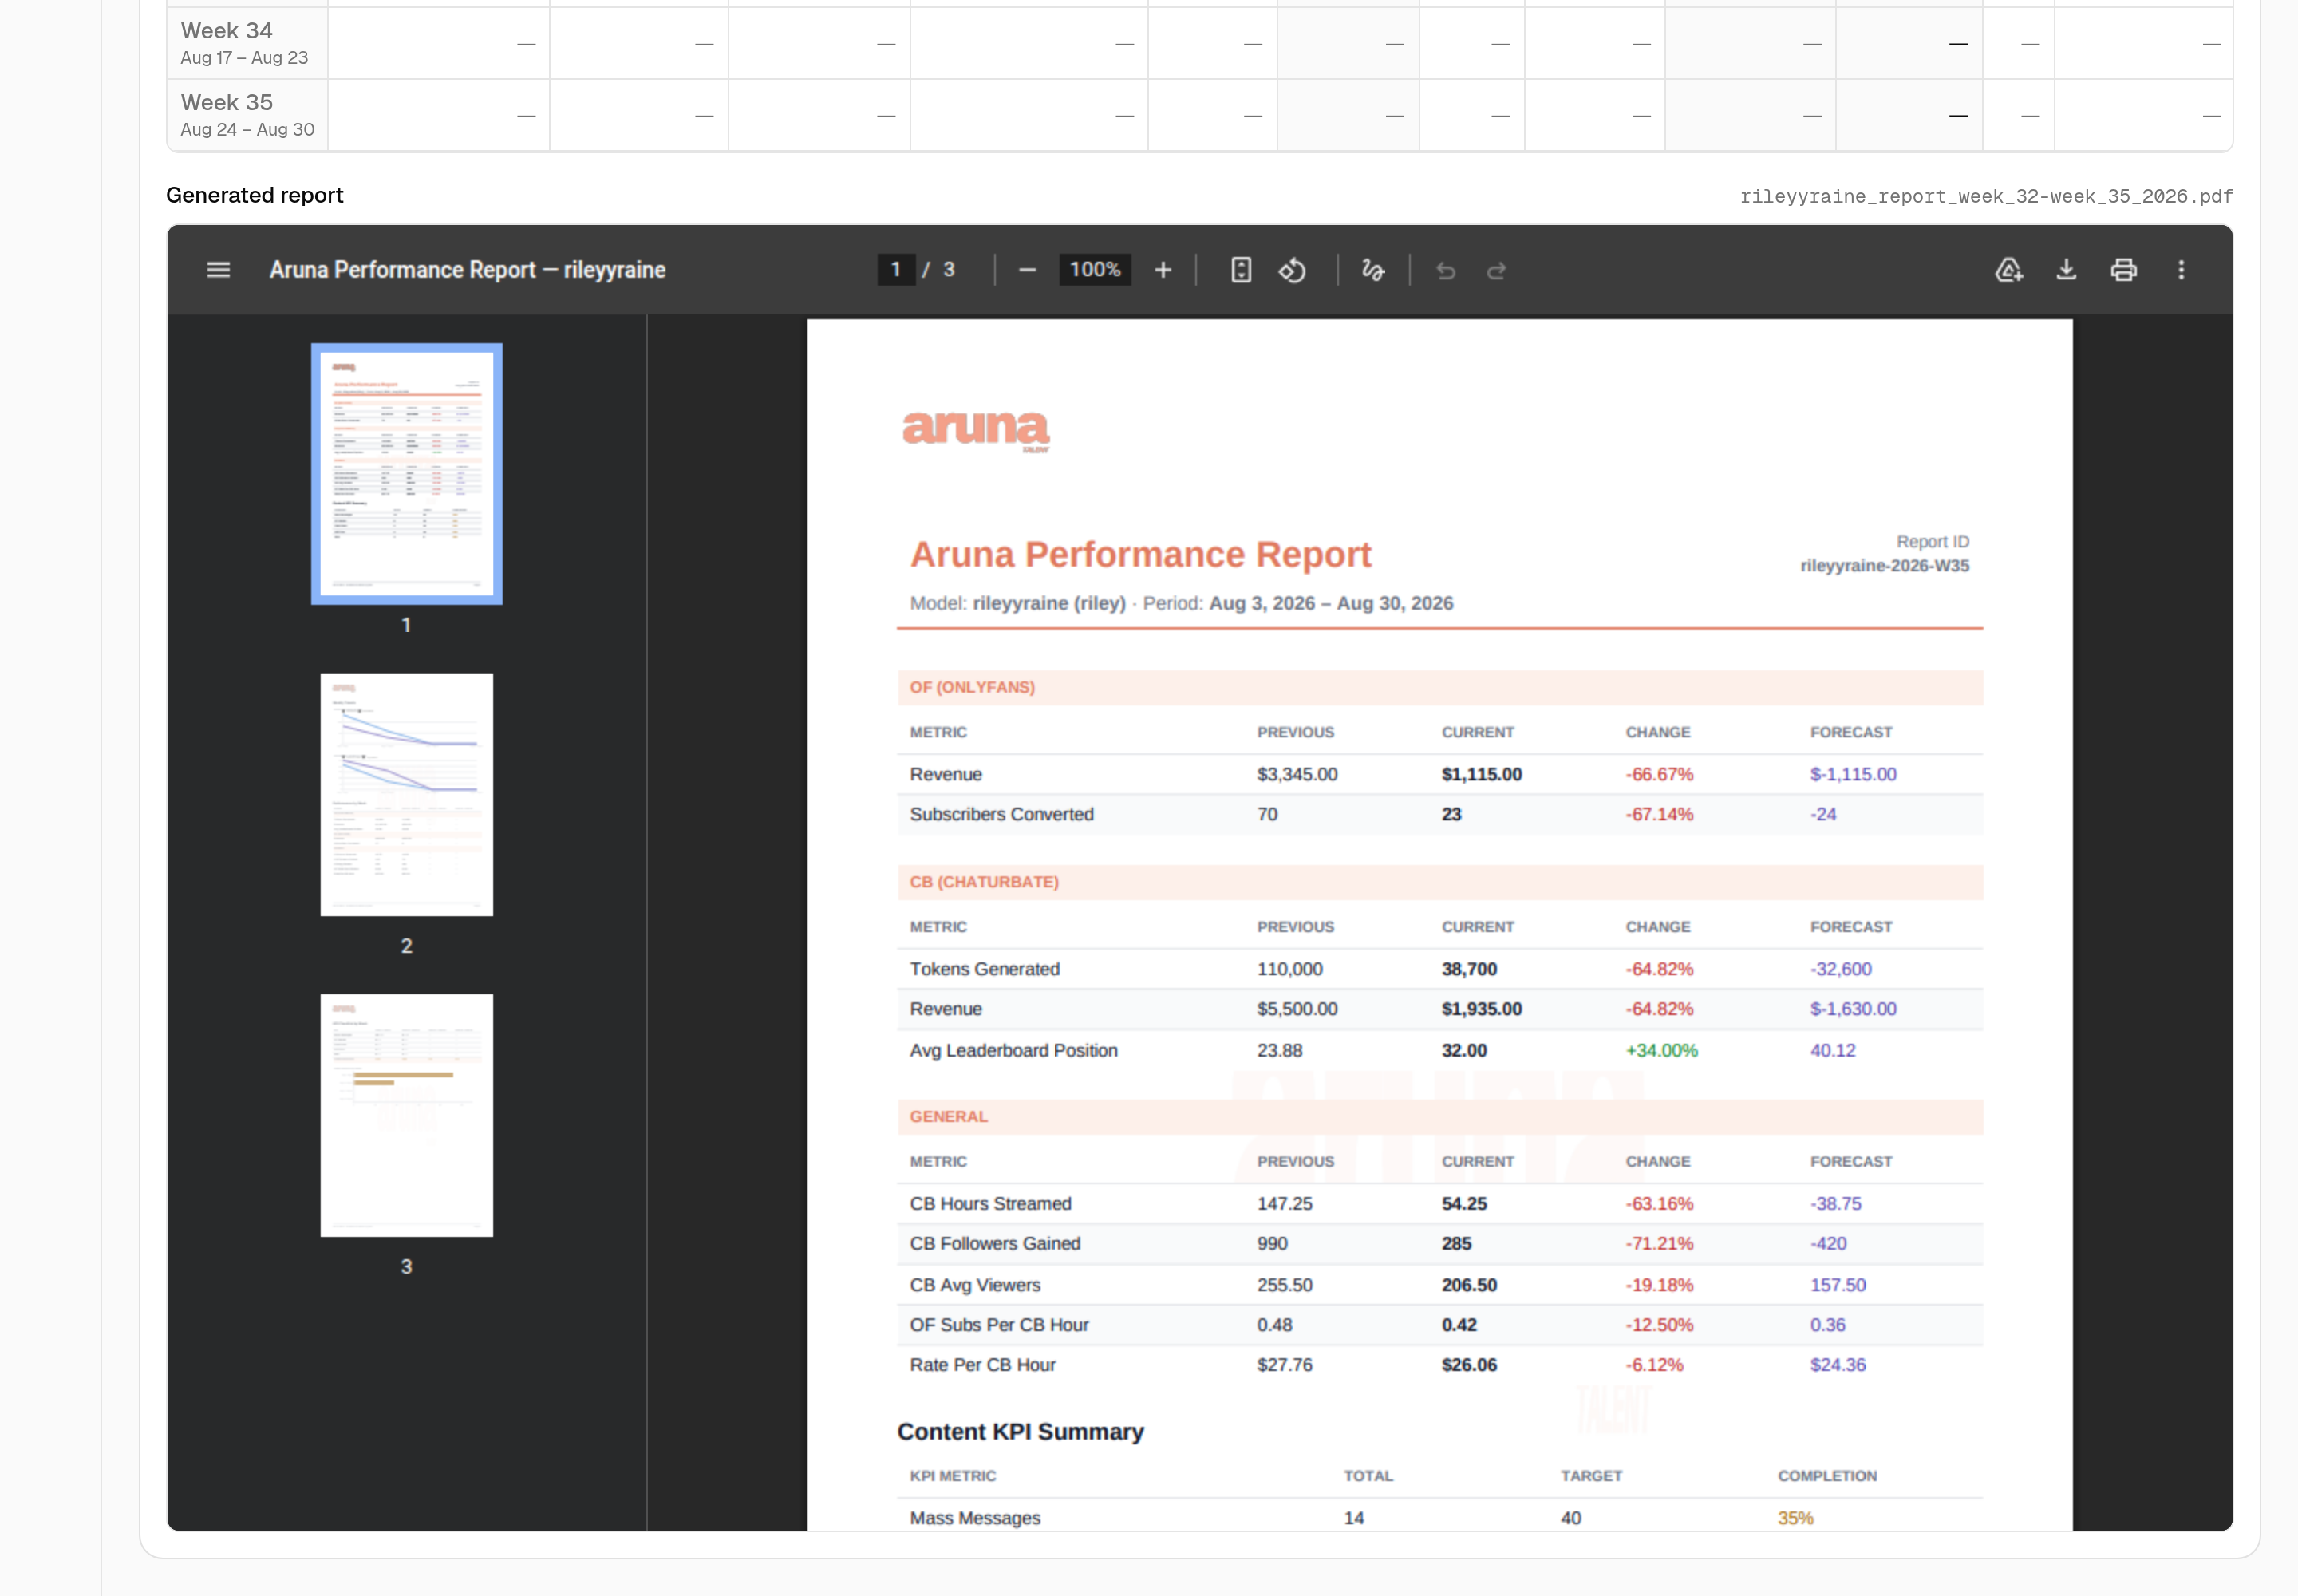
- Weeks in this period — the window's sheet rows, exactly as the Weekly sheet shows them but read-only. A week nobody filled in is still listed, dashed out, so a gap in the window is visible rather than a shorter table. Edit these on the Weekly sheet tab; they're read-only here on purpose, so a figure can't be changed while you're looking at a PDF built from the old one.
- Generated report — once a PDF exists for the period, the document itself, embedded. No need to download it just to check it reads correctly. If your browser can't display PDFs inline, an Open in a new tab button appears instead.
Generate, then download
A period's PDF has to be built before it can be downloaded, so the button tells you which state you're in:
- No PDF yet → a single Generate PDF button, and the line beneath says so. Nothing has been rendered for this window.
- Already built → Download PDF, plus Regenerate beside it. The line beneath names the file and when it was made.
Use Regenerate after you edit a week. A built PDF is kept as-is, so a report made before you corrected a figure keeps serving the old numbers until you rebuild it.
The file is named for the model and the window it covers — for example
rileyyraine_report_week_31-week_34_2026.pdf for a monthly window, or
rileyyraine_report_week_34_2026.pdf for a weekly one — so a downloaded report
is identifiable without opening it.
The two cadences are archived separately, so a weekly and a monthly report that
happen to end on the same week never overwrite one another. The weekly one's
report id carries a -weekly suffix for the same reason.
There's no "send to model" here. You generate, download, review, and send it yourself.
What the model does not see
Client satisfaction and Churn risk are internal only. Record them honestly — they never appear on the model-facing PDF.
Customs aren't on the PDF either. They're a record you keep for now, not part of the report the model receives.
The Monday nudge
Every Monday morning you get one email per manager: how many of your models have last week recorded, and which ones don't, with a link to the board. Nothing to record means the email says so.
Reports for the previous month are built and archived automatically on the 1st. That job only prepares them — nothing is sent to anyone.
About ISO weeks
The sheet is organised by ISO week, which is not quite the calendar:
- A week always runs Monday to Sunday.
- Week 1 is the week containing the first Thursday of January — so 2026-W01 starts Monday 29 December 2025. A week can belong to a different year than its dates suggest.
- A year has 52 or 53 weeks. 2026 has 53 — the sheet counts "10 of 53 weeks recorded", and Start at week won't accept a number the year doesn't have.
This is why the sheet shows the date range under every week number — you should never have to work out which days a week covers.
Troubleshooting
| Problem | What to do |
|---|---|
| A model isn't in Models you manage | Check Retainer Mapping — the assignment is what puts it in your queue. You can still record for it from the other group |
| The models list is empty | Your account has management.tmt.model_performance but no linked employee record (e.g. an admin login). Ask P&C to link it; assignments hang off the employee, not the login |
| A cell won't keep my value | The save failed and the cell reverted. The toast says why — usually a value the field won't take (a decimal in a whole-number column, or a negative) |
| I need a week that isn't there | Weeks are appended in order with + Add week N. To start later in the year, use Start at week on an empty sheet |
| + Add week is disabled | The year is fully recorded — all 52 (or 53) weeks exist |
| Completion is over 100% | Correct and intended. The model beat the targets |
| Every past completion rate changed | Someone edited the Weekly KPI targets. Targets are live, not frozen per week |
| The report is missing weeks | Only recorded weeks count. Unrecorded weeks are left out of the totals rather than counted as zero — fill the sheet, then rebuild |
| Last week isn't in any report period | By design — the newest window ends the week before the current one |
| The report shows the wrong model name | The breadcrumb and title use the model's handle and name from the Models module; fix it there |
| Download PDF isn't there, only Generate PDF | Nothing has been built for that period yet. Generate it once and Download appears |
| The PDF doesn't reflect a figure I just fixed | A built PDF is kept as-is. Use Regenerate to rebuild it from the corrected week |
| CB revenue won't let me type in it | It's computed — tokens × the token rate. Correct the CB tokens cell instead |
| Every past CB revenue changed | Someone edited the Chaturbate token rate in settings. Like the targets, it's live, not frozen per week |